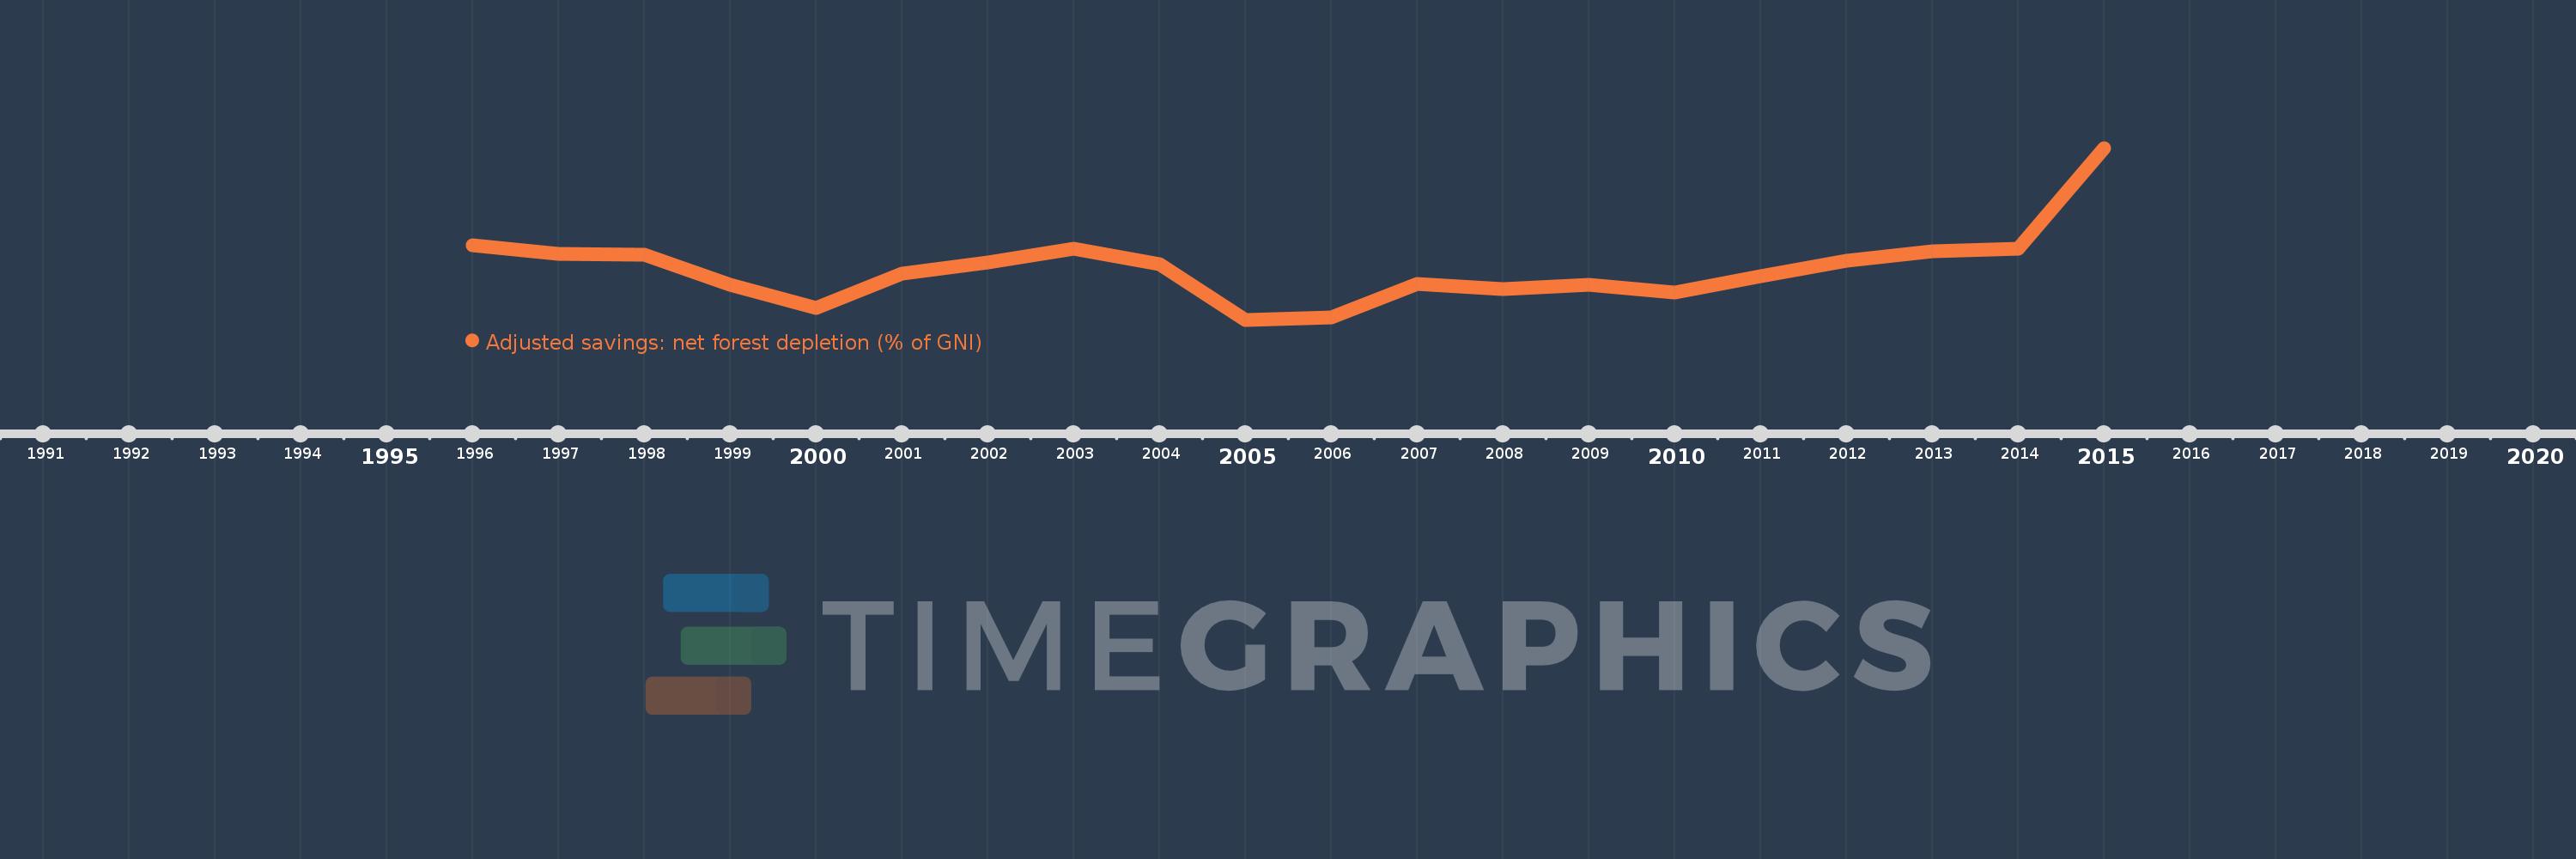
This timeline shows a graph from 1996 to 2015 of Slovenia. No data until 1995. Number of actual observations by date: 20.
Source name:
World Development Indicators
Source organization:
World Bank staff estimates based on sources and methods in World Bank's "The Changing Wealth of Nations: Measuring Sustainable Development in the New Millennium" (2011).
Categories, topics:
Economy & Growth, Environment
Last updated:
apr 23, 2017
Indicators value changes by year
Meaning:
0.292
Minimum:
0.202
jan 1, 2005
Maximum:
0.503
jan 1, 2015
At the date of observation
Value
Absolute change
Change from the previous value
jan 1, 1996
0.333
+0.333
0.0%
jan 1, 1997
0.318
-0.015
-4.44%
jan 1, 1998
0.316
-0.002
-0.68%
jan 1, 1999
0.263
-0.054
-16.98%
jan 1, 2000
0.222
-0.041
-15.45%
jan 1, 2001
0.283
+0.061
27.35%
jan 1, 2002
0.302
+0.019
6.69%
jan 1, 2003
0.327
+0.026
8.48%
jan 1, 2004
0.299
-0.029
-8.73%
jan 1, 2005
0.202
-0.096
-32.23%
jan 1, 2006
0.206
+0.004
1.97%
jan 1, 2007
0.265
+0.059
28.48%
jan 1, 2008
0.256
-0.01
-3.63%
jan 1, 2009
0.264
+0.009
3.48%
jan 1, 2010
0.249
-0.015
-5.83%
jan 1, 2011
0.278
+0.029
11.68%
jan 1, 2012
0.305
+0.027
9.75%
jan 1, 2013
0.322
+0.017
5.52%
jan 1, 2014
0.327
+0.005
1.51%
jan 1, 2015
0.503
+0.176
53.86%
Ranking of countries by current statistics by years