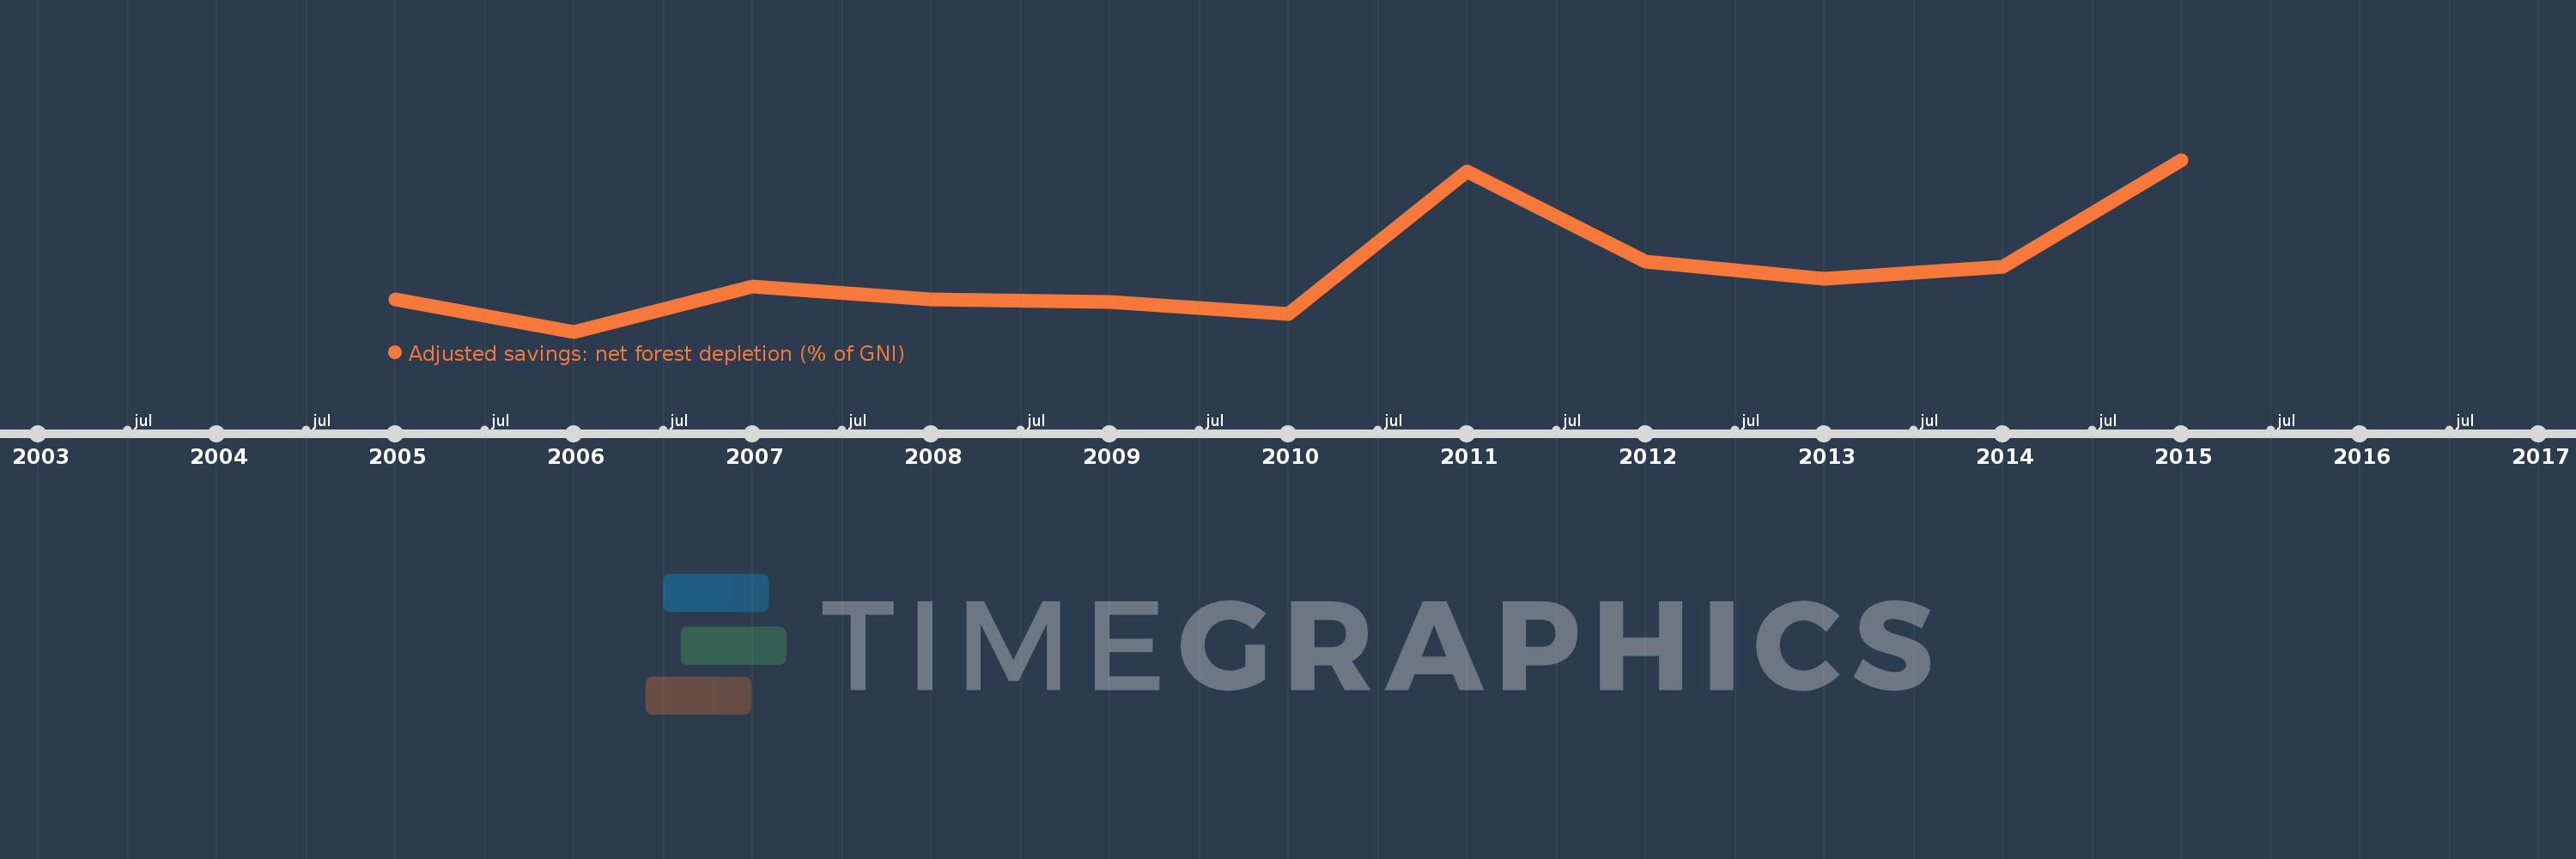
This timeline shows a graph from 2005 to 2015 of Haiti. No data until 2004. Number of actual observations by date: 11.
Source name:
World Development Indicators
Source organization:
World Bank staff estimates based on sources and methods in World Bank's "The Changing Wealth of Nations: Measuring Sustainable Development in the New Millennium" (2011).
Categories, topics:
Economy & Growth, Environment
Last updated:
apr 23, 2017
Indicators value changes by year
Meaning:
1.97
Minimum:
1.365
jan 1, 2006
Maximum:
3.056
jan 1, 2015
At the date of observation
Value
Absolute change
Change from the previous value
jan 1, 2005
1.678
+1.678
0.0%
jan 1, 2006
1.365
-0.313
-18.64%
jan 1, 2007
1.809
+0.443
32.48%
jan 1, 2008
1.678
-0.13
-7.2%
jan 1, 2009
1.658
-0.02
-1.18%
jan 1, 2010
1.535
-0.123
-7.43%
jan 1, 2011
2.944
+1.409
91.76%
jan 1, 2012
2.058
-0.886
-30.09%
jan 1, 2013
1.886
-0.173
-8.38%
jan 1, 2014
2.001
+0.115
6.11%
jan 1, 2015
3.056
+1.055
52.73%
Ranking of countries by current statistics by years