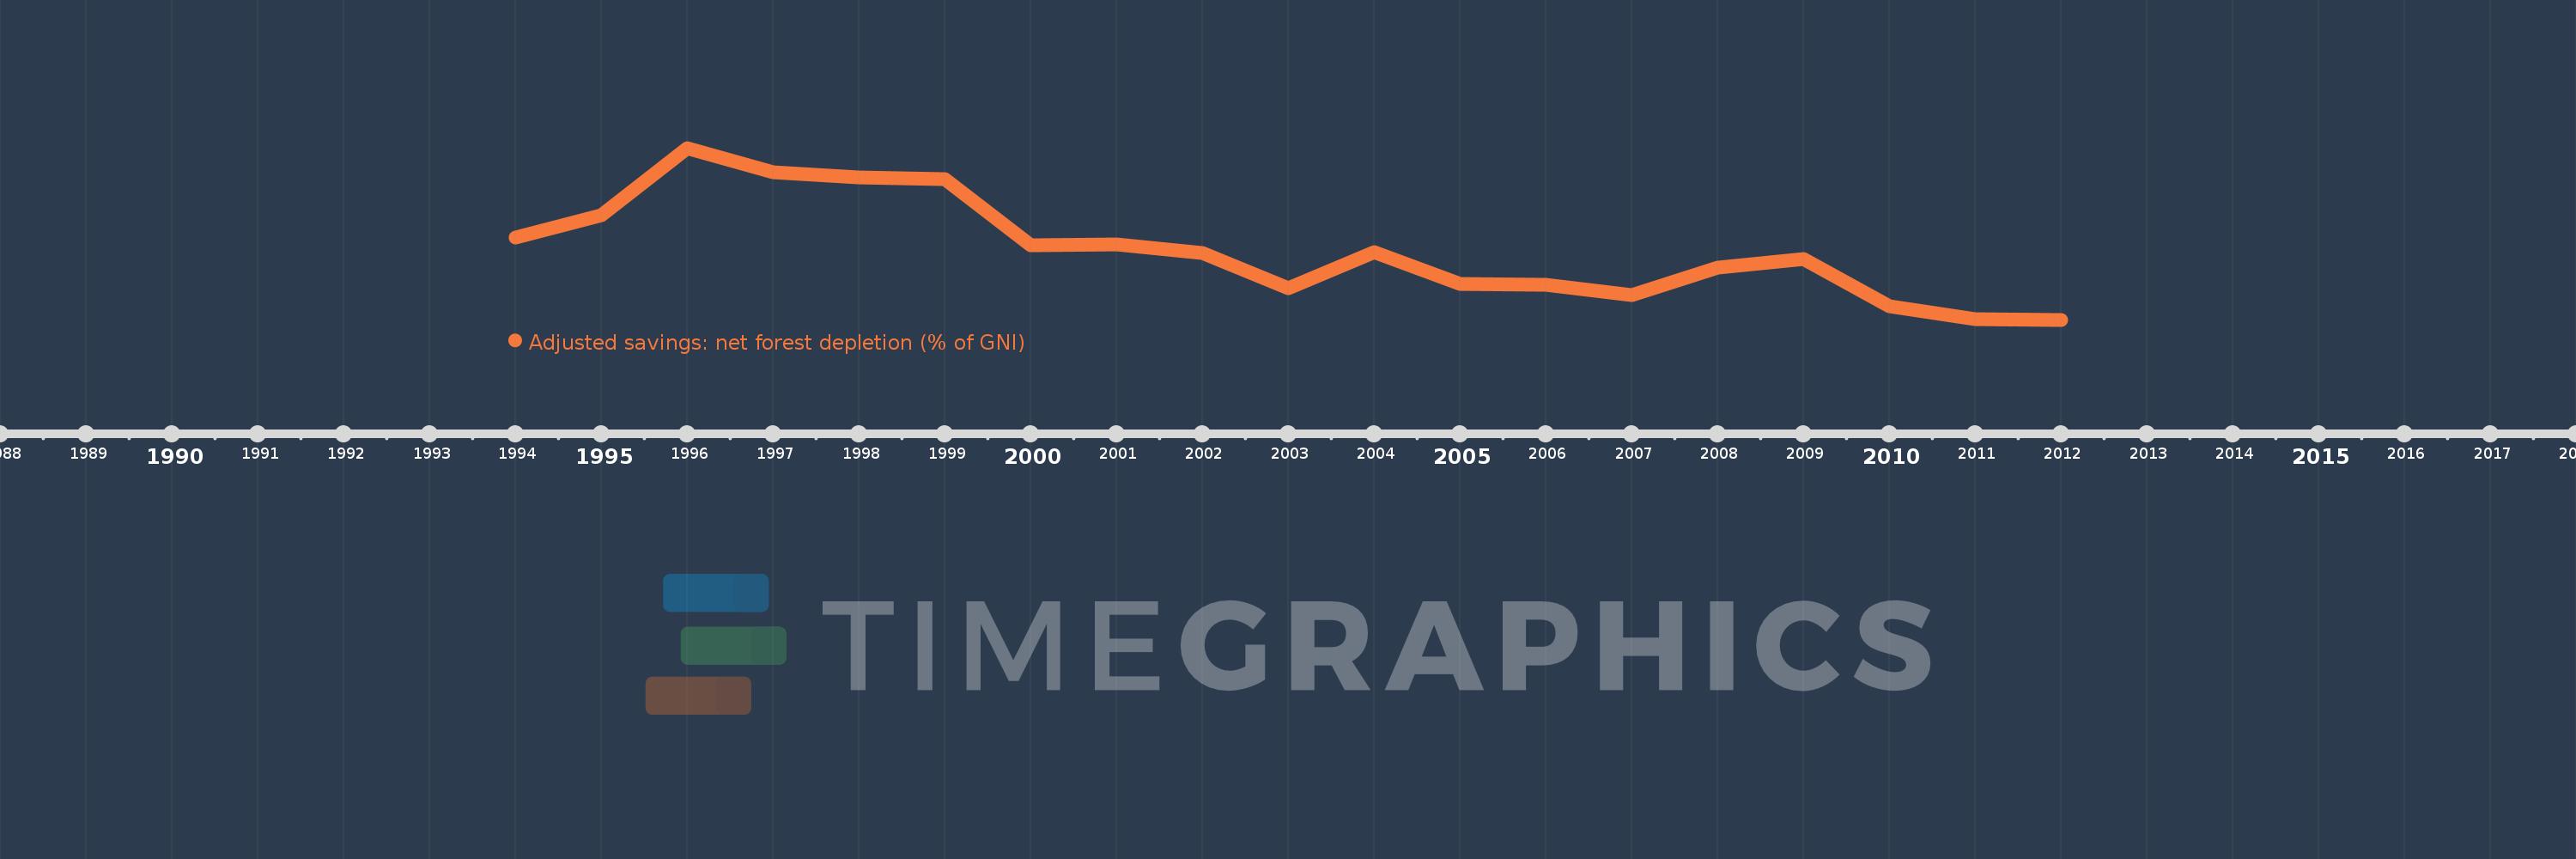
This timeline shows a graph from 1994 to 2012 of Eritrea. No data until 1993. Number of actual observations by date: 19.
Source name:
World Development Indicators
Source organization:
World Bank staff estimates based on sources and methods in World Bank's "The Changing Wealth of Nations: Measuring Sustainable Development in the New Millennium" (2011).
Categories, topics:
Economy & Growth, Environment
Last updated:
apr 23, 2017
Indicators value changes by year
Meaning:
4.537
Minimum:
1.768
jan 1, 2012
Maximum:
8.58
jan 1, 1996
At the date of observation
Value
Absolute change
Change from the previous value
jan 1, 1994
5.016
+5.016
0.0%
jan 1, 1995
5.903
+0.886
17.67%
jan 1, 1996
8.58
+2.677
45.35%
jan 1, 1997
7.607
-0.973
-11.34%
jan 1, 1998
7.427
-0.18
-2.36%
jan 1, 1999
7.347
-0.081
-1.09%
jan 1, 2000
4.711
-2.636
-35.88%
jan 1, 2001
4.765
+0.054
1.15%
jan 1, 2002
4.427
-0.337
-7.08%
jan 1, 2003
3.03
-1.397
-31.56%
jan 1, 2004
4.441
+1.41
46.54%
jan 1, 2005
3.198
-1.242
-27.98%
jan 1, 2006
3.163
-0.035
-1.11%
jan 1, 2007
2.736
-0.427
-13.5%
jan 1, 2008
3.841
+1.106
40.41%
jan 1, 2009
4.162
+0.32
8.34%
jan 1, 2010
2.292
-1.869
-44.91%
jan 1, 2011
1.793
-0.499
-21.78%
jan 1, 2012
1.768
-0.025
-1.41%
Ranking of countries by current statistics by years