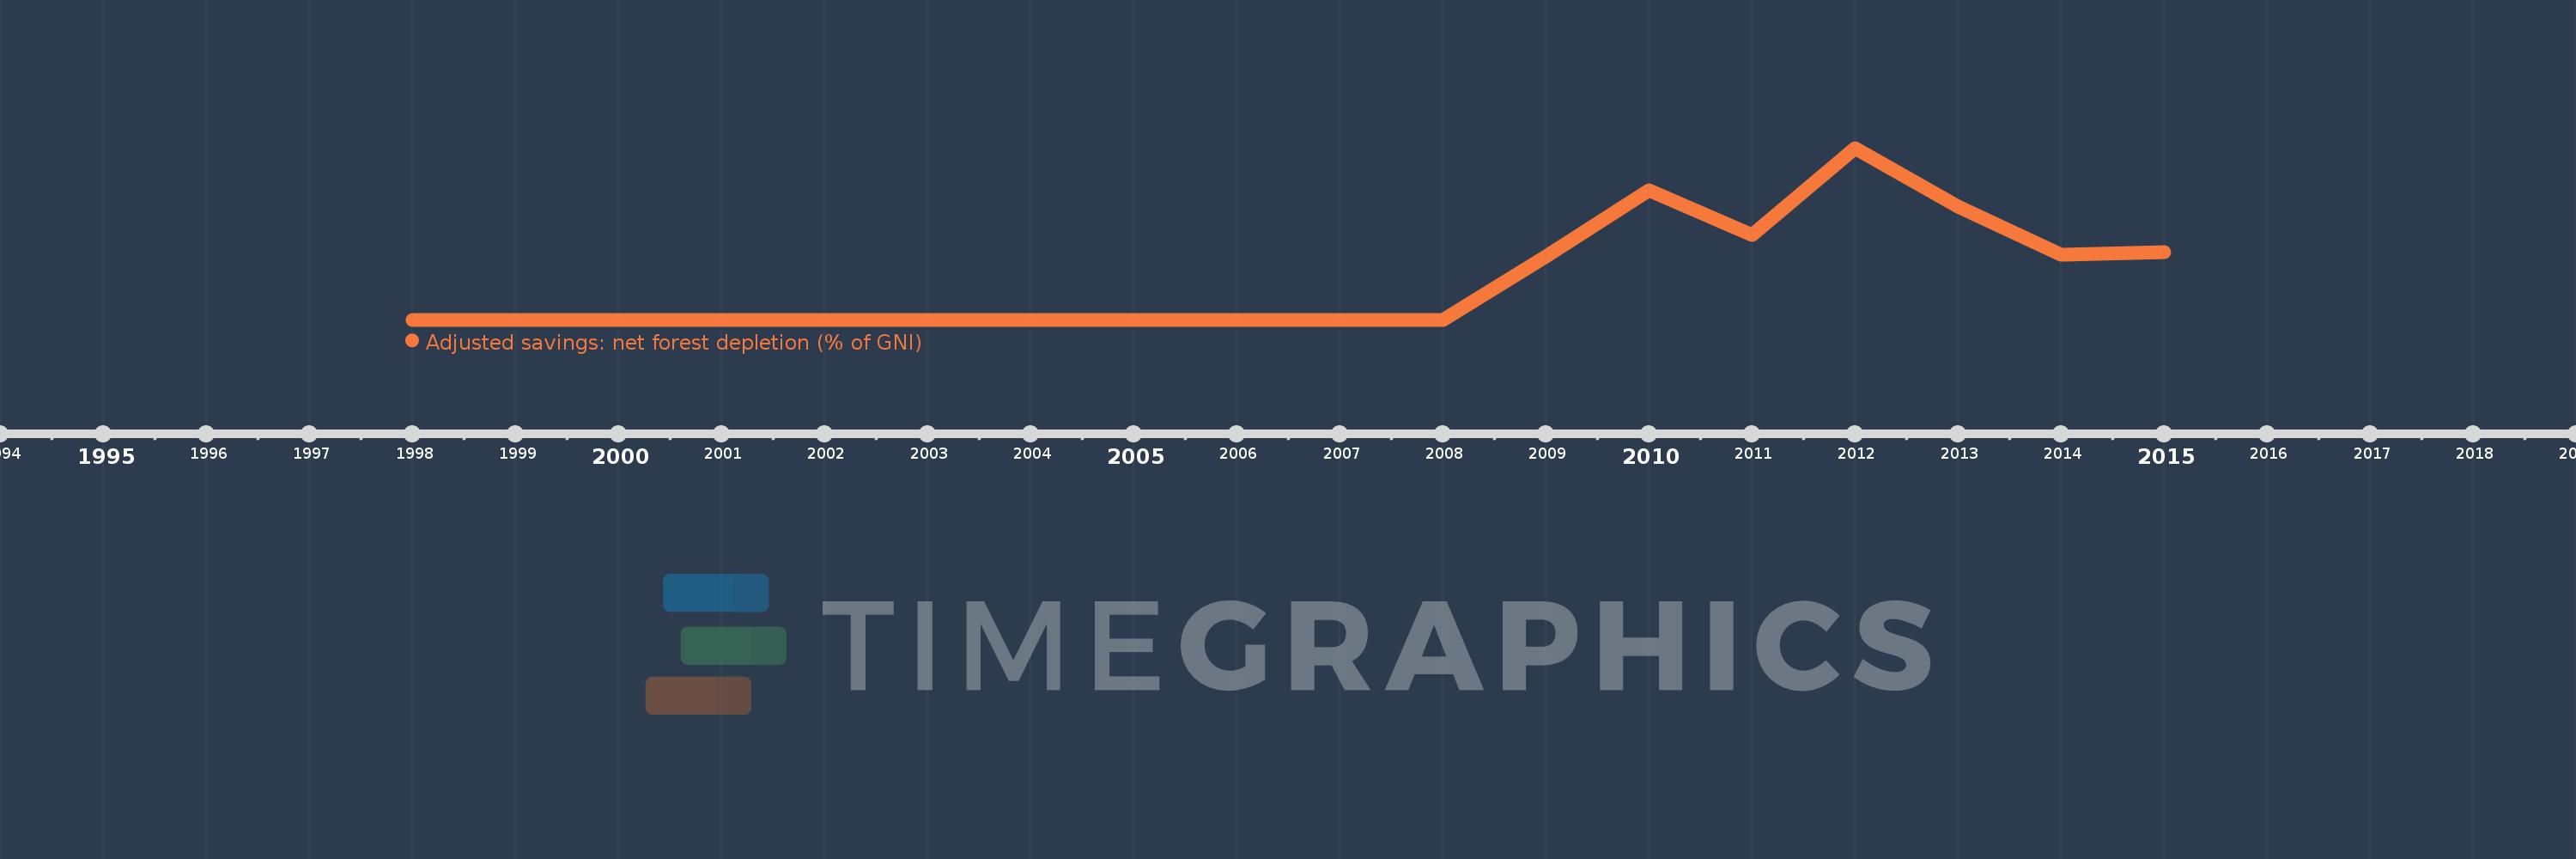
This timeline shows a graph from 1998 to 2015 of Armenia. No data until 1997. Number of actual observations by date: 16.
Source name:
World Development Indicators
Source organization:
World Bank staff estimates based on sources and methods in World Bank's "The Changing Wealth of Nations: Measuring Sustainable Development in the New Millennium" (2011).
Categories, topics:
Economy & Growth, Environment
Last updated:
apr 23, 2017
Indicators value changes by year
Meaning:
0.117
Minimum:
0.0
jan 1, 1998
Maximum:
0.46
jan 1, 2012
At the date of observation
Value
Absolute change
Change from the previous value
jan 1, 1998
0.0
0.0
0.0%
jan 1, 2001
0.0
0.0
%
jan 1, 2002
0.0
0.0
%
jan 1, 2003
0.0
0.0
%
jan 1, 2004
0.0
0.0
%
jan 1, 2005
0.0
0.0
%
jan 1, 2006
0.0
0.0
%
jan 1, 2007
0.0
0.0
%
jan 1, 2008
0.0
0.0
%
jan 1, 2009
0.17
+0.17
%
jan 1, 2010
0.346
+0.175
103.22%
jan 1, 2011
0.228
-0.117
-33.94%
jan 1, 2012
0.46
+0.232
101.53%
jan 1, 2013
0.304
-0.156
-33.84%
jan 1, 2014
0.175
-0.129
-42.48%
jan 1, 2015
0.182
+0.007
4.06%
Ranking of countries by current statistics by years