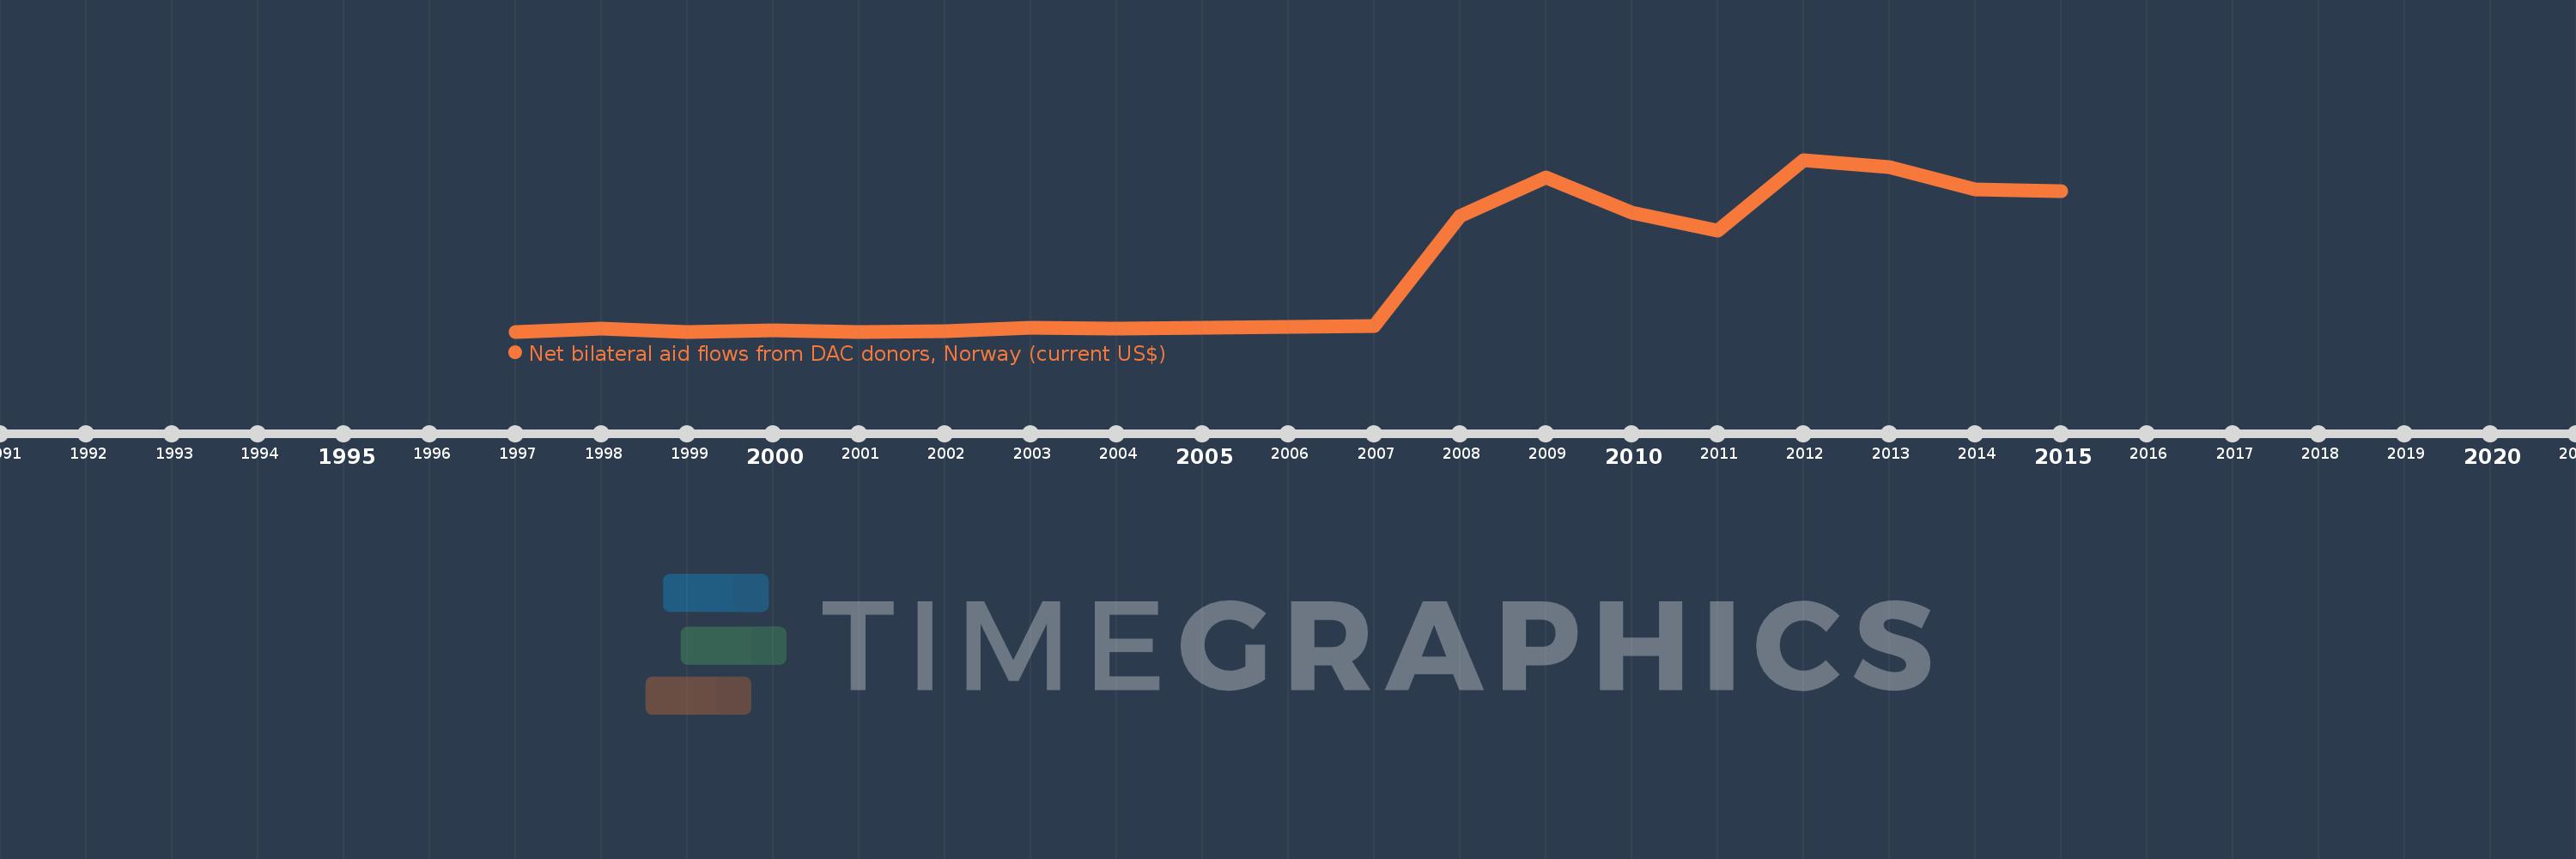
This timeline shows a graph from 1997 to 2015 of Belarus. No data until 1996. Number of actual observations by date: 17.
Source name:
World Development Indicators
Source organization:
Development Assistance Committee of the Organisation for Economic Co-operation and Development, Geographical Distribution of Financial Flows to Developing Countries, Development Co-operation Report, and International Development Statistics database. Data are available online at: www.oecd.org/dac/stats/idsonline.
Categories, topics:
Aid Effectiveness
Last updated:
apr 23, 2017
Indicators value changes by year
Meaning:
1.474 mln
Minimum:
80.0K
jan 1, 1997
Maximum:
3.7 mln
jan 1, 2012
At the date of observation
Value
Absolute change
Change from the previous value
jan 1, 1997
80.0K
+80.0K
0.0%
jan 1, 1998
150.0K
+70.0K
87.5%
jan 1, 1999
80.0K
-70.0K
-46.67%
jan 1, 2000
110.0K
+30.0K
37.5%
jan 1, 2001
80.0K
-30.0K
-27.27%
jan 1, 2002
90.0K
+10.0K
12.5%
jan 1, 2003
160.0K
+70.0K
77.78%
jan 1, 2004
140.0K
-20.0K
-12.5%
jan 1, 2007
190.0K
+50.0K
35.71%
jan 1, 2008
2.51 mln
+2.32 mln
1.22K%
jan 1, 2009
3.32 mln
+810.0K
32.27%
jan 1, 2010
2.58 mln
-740.0K
-22.29%
jan 1, 2011
2.21 mln
-370.0K
-14.34%
jan 1, 2012
3.7 mln
+1.49 mln
67.42%
jan 1, 2013
3.54 mln
-160.0K
-4.32%
jan 1, 2014
3.08 mln
-460.0K
-12.99%
jan 1, 2015
3.04 mln
-40.0K
-1.3%
Ranking of countries by current statistics by years