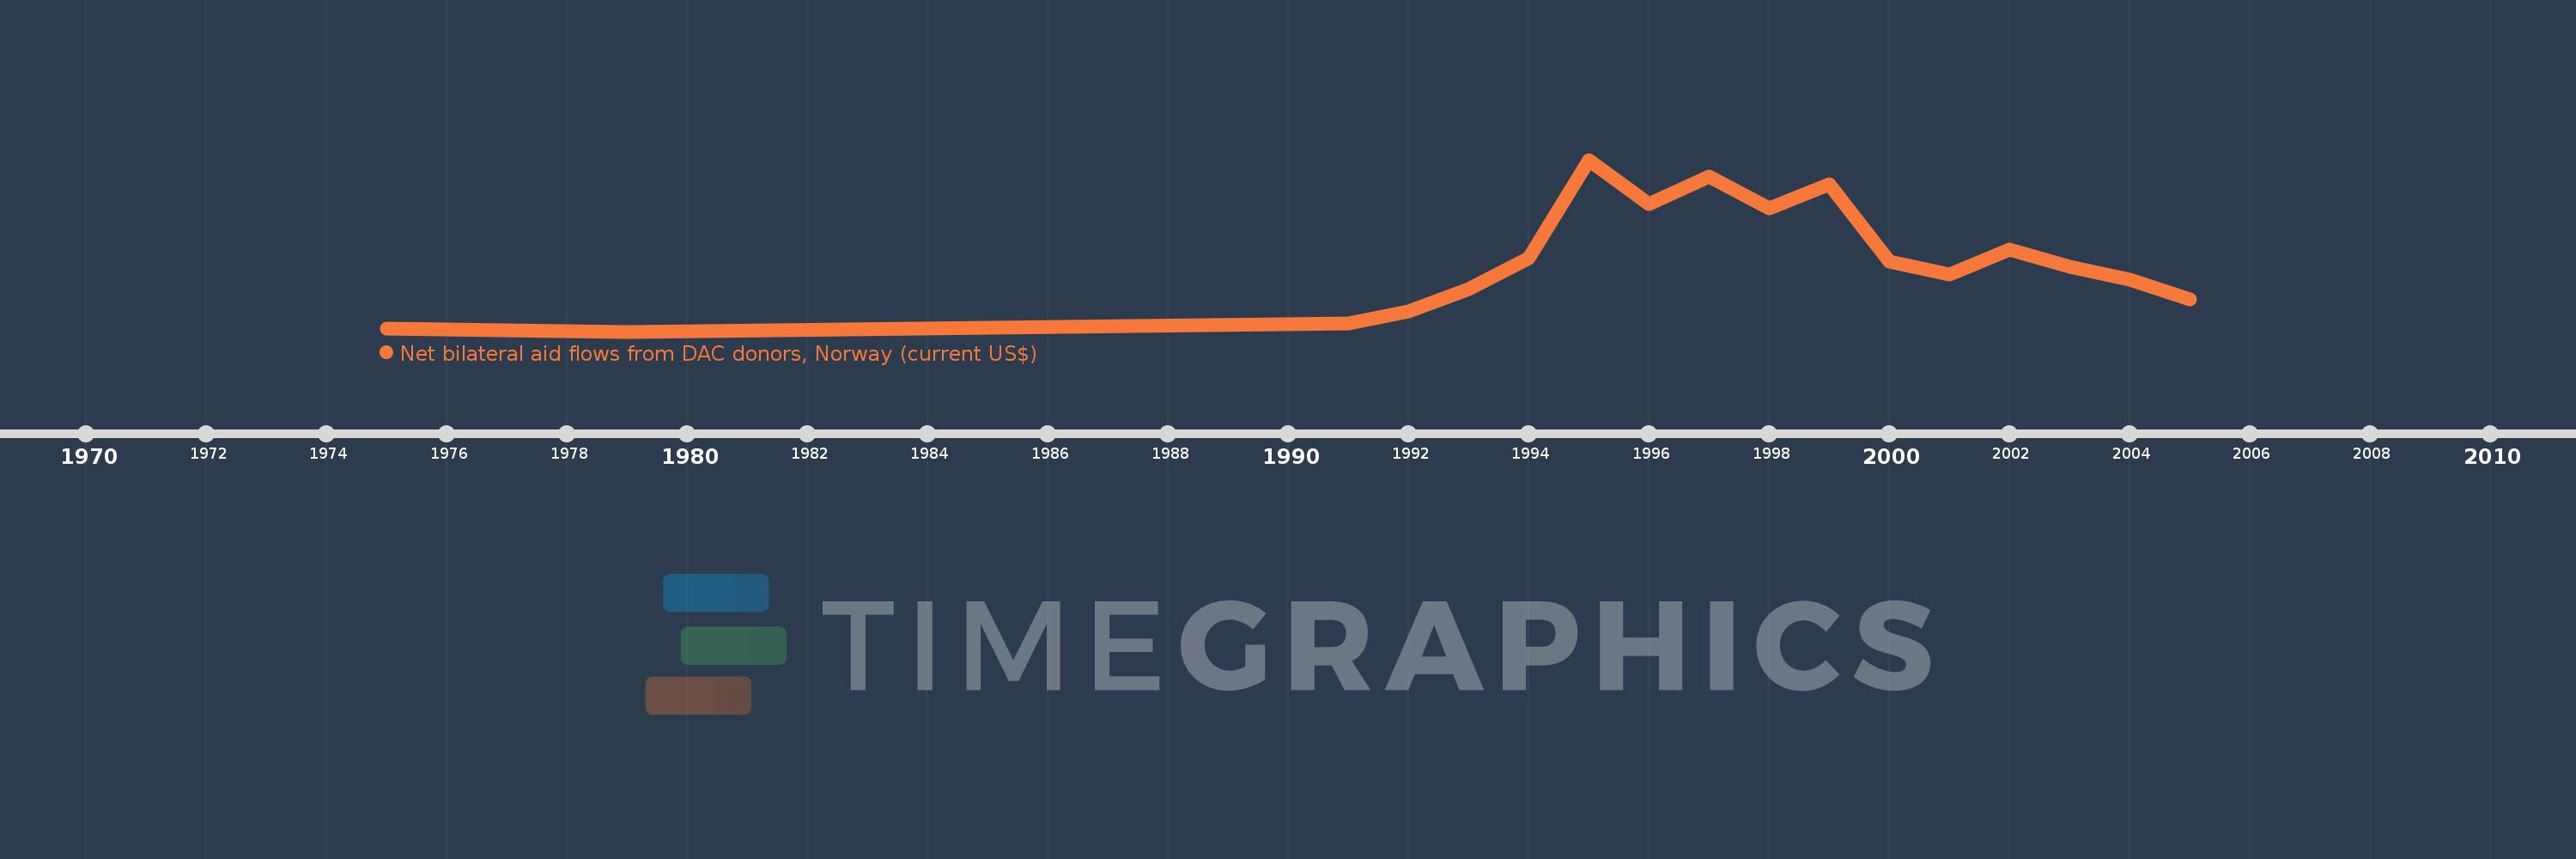
This timeline shows a graph from 1975 to 2005 of Euro area. No data until 1974. Number of actual observations by date: 17.
Source name:
World Development Indicators
Source organization:
Development Assistance Committee of the Organisation for Economic Co-operation and Development, Geographical Distribution of Financial Flows to Developing Countries, Development Co-operation Report, and International Development Statistics database. Data are available online at: www.oecd.org/dac/stats/idsonline.
Categories, topics:
Aid Effectiveness
Last updated:
apr 23, 2017
Indicators value changes by year
Meaning:
3.801 mln
Minimum:
10.0K
jan 1, 1979
Maximum:
9.01 mln
jan 1, 1995
At the date of observation
Value
Absolute change
Change from the previous value
jan 1, 1975
180.0K
+180.0K
0.0%
jan 1, 1979
10.0K
-170.0K
-94.44%
jan 1, 1991
430.0K
+420.0K
4.2K%
jan 1, 1992
1.05 mln
+620.0K
144.19%
jan 1, 1993
2.25 mln
+1.2 mln
114.29%
jan 1, 1994
3.85 mln
+1.6 mln
71.11%
jan 1, 1995
9.01 mln
+5.16 mln
134.03%
jan 1, 1996
6.68 mln
-2.33 mln
-25.86%
jan 1, 1997
8.14 mln
+1.46 mln
21.86%
jan 1, 1998
6.46 mln
-1.68 mln
-20.64%
jan 1, 1999
7.73 mln
+1.27 mln
19.66%
jan 1, 2000
3.66 mln
-4.07 mln
-52.65%
jan 1, 2001
3.0 mln
-660.0K
-18.03%
jan 1, 2002
4.3 mln
+1.3 mln
43.33%
jan 1, 2003
3.4 mln
-900.0K
-20.93%
jan 1, 2004
2.75 mln
-650.0K
-19.12%
jan 1, 2005
1.71 mln
-1.04 mln
-37.82%
Ranking of countries by current statistics by years