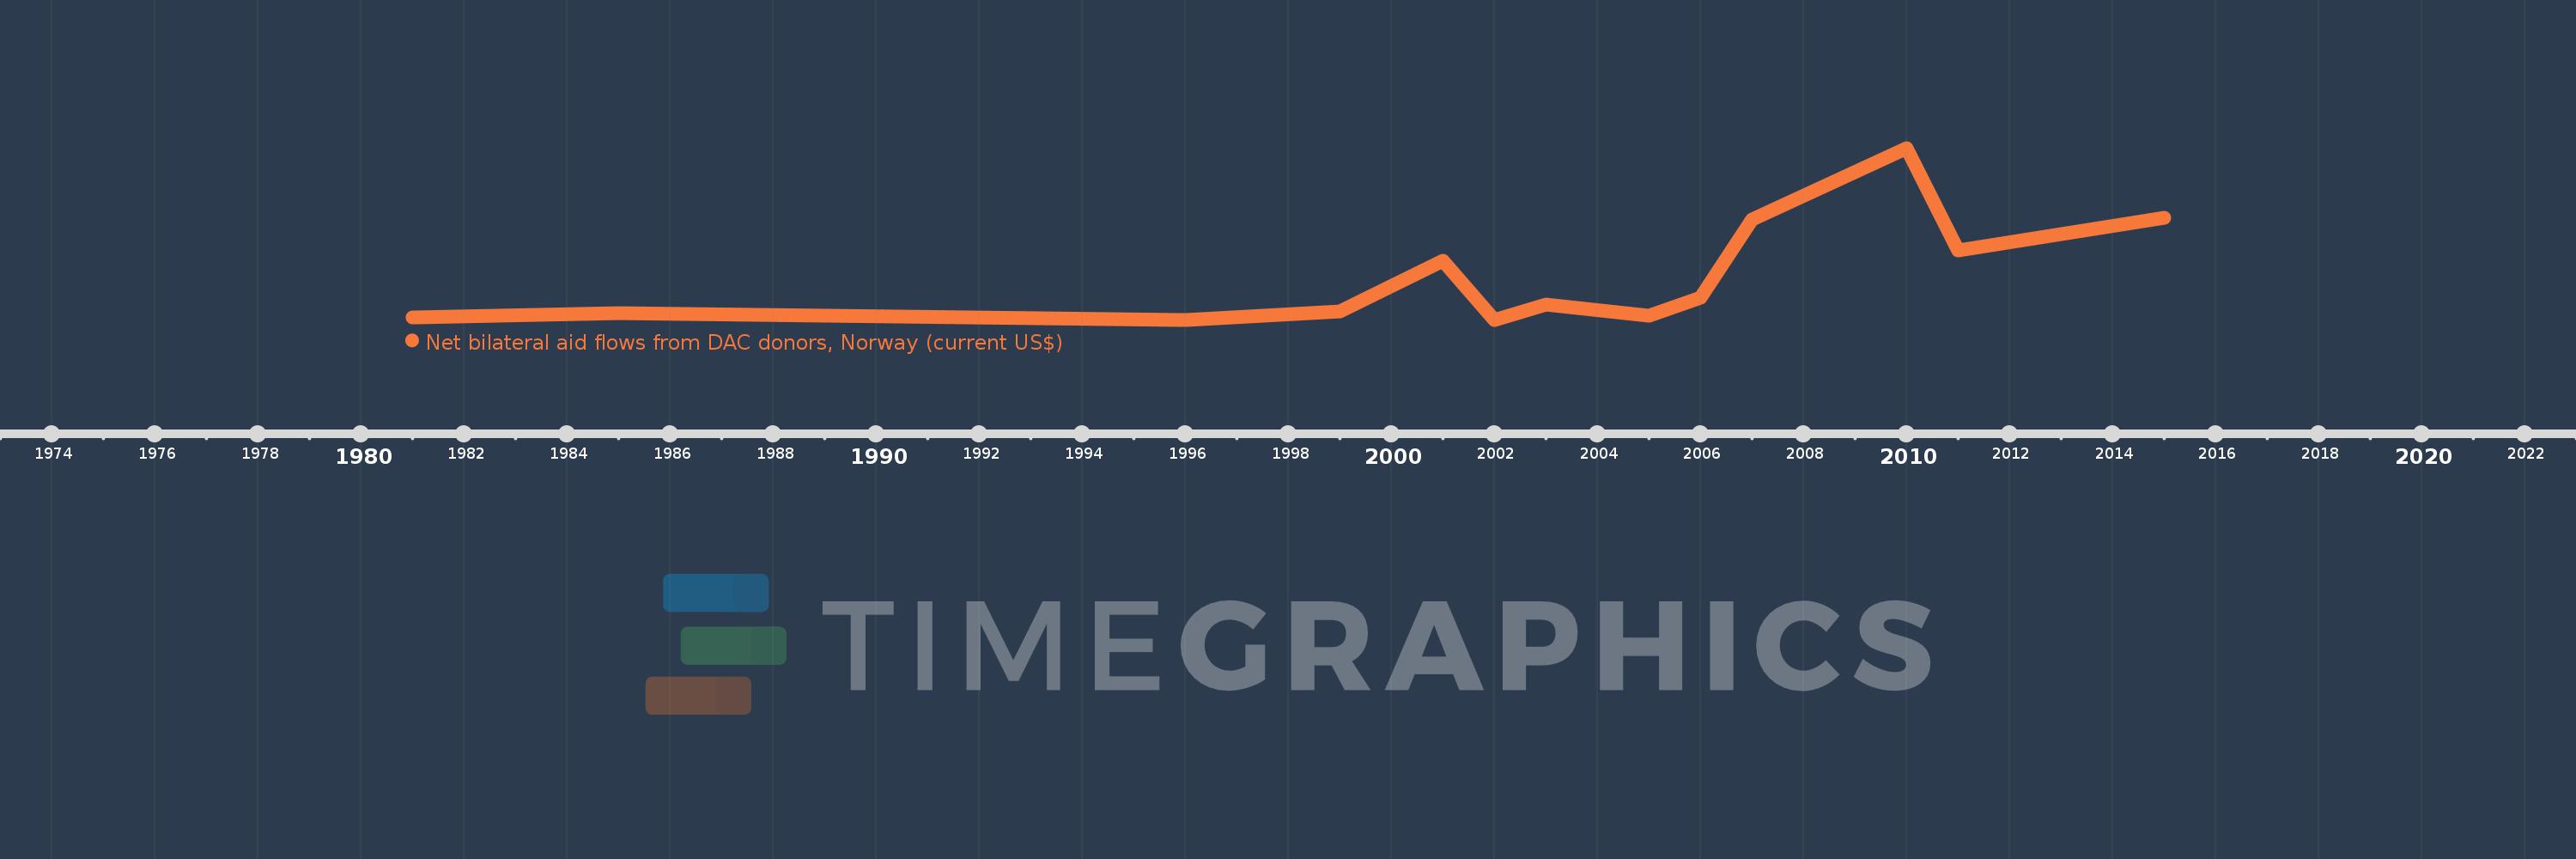
This timeline shows a graph from 1981 to 2015 of Djibouti. No data until 1980. Number of actual observations by date: 13.
Source name:
World Development Indicators
Source organization:
Development Assistance Committee of the Organisation for Economic Co-operation and Development, Geographical Distribution of Financial Flows to Developing Countries, Development Co-operation Report, and International Development Statistics database. Data are available online at: www.oecd.org/dac/stats/idsonline.
Categories, topics:
Aid Effectiveness
Last updated:
apr 23, 2017
Indicators value changes by year
Meaning:
208.462K
Minimum:
10.0K
jan 1, 1996
Maximum:
800.0K
jan 1, 2010
At the date of observation
Value
Absolute change
Change from the previous value
jan 1, 1981
20.0K
+20.0K
0.0%
jan 1, 1985
40.0K
+20.0K
100.0%
jan 1, 1996
10.0K
-30.0K
-75.0%
jan 1, 1999
50.0K
+40.0K
400.0%
jan 1, 2001
280.0K
+230.0K
460.0%
jan 1, 2002
10.0K
-270.0K
-96.43%
jan 1, 2003
80.0K
+70.0K
700.0%
jan 1, 2005
30.0K
-50.0K
-62.5%
jan 1, 2006
110.0K
+80.0K
266.67%
jan 1, 2007
470.0K
+360.0K
327.27%
jan 1, 2010
800.0K
+330.0K
70.21%
jan 1, 2011
330.0K
-470.0K
-58.75%
jan 1, 2015
480.0K
+150.0K
45.45%
Ranking of countries by current statistics by years