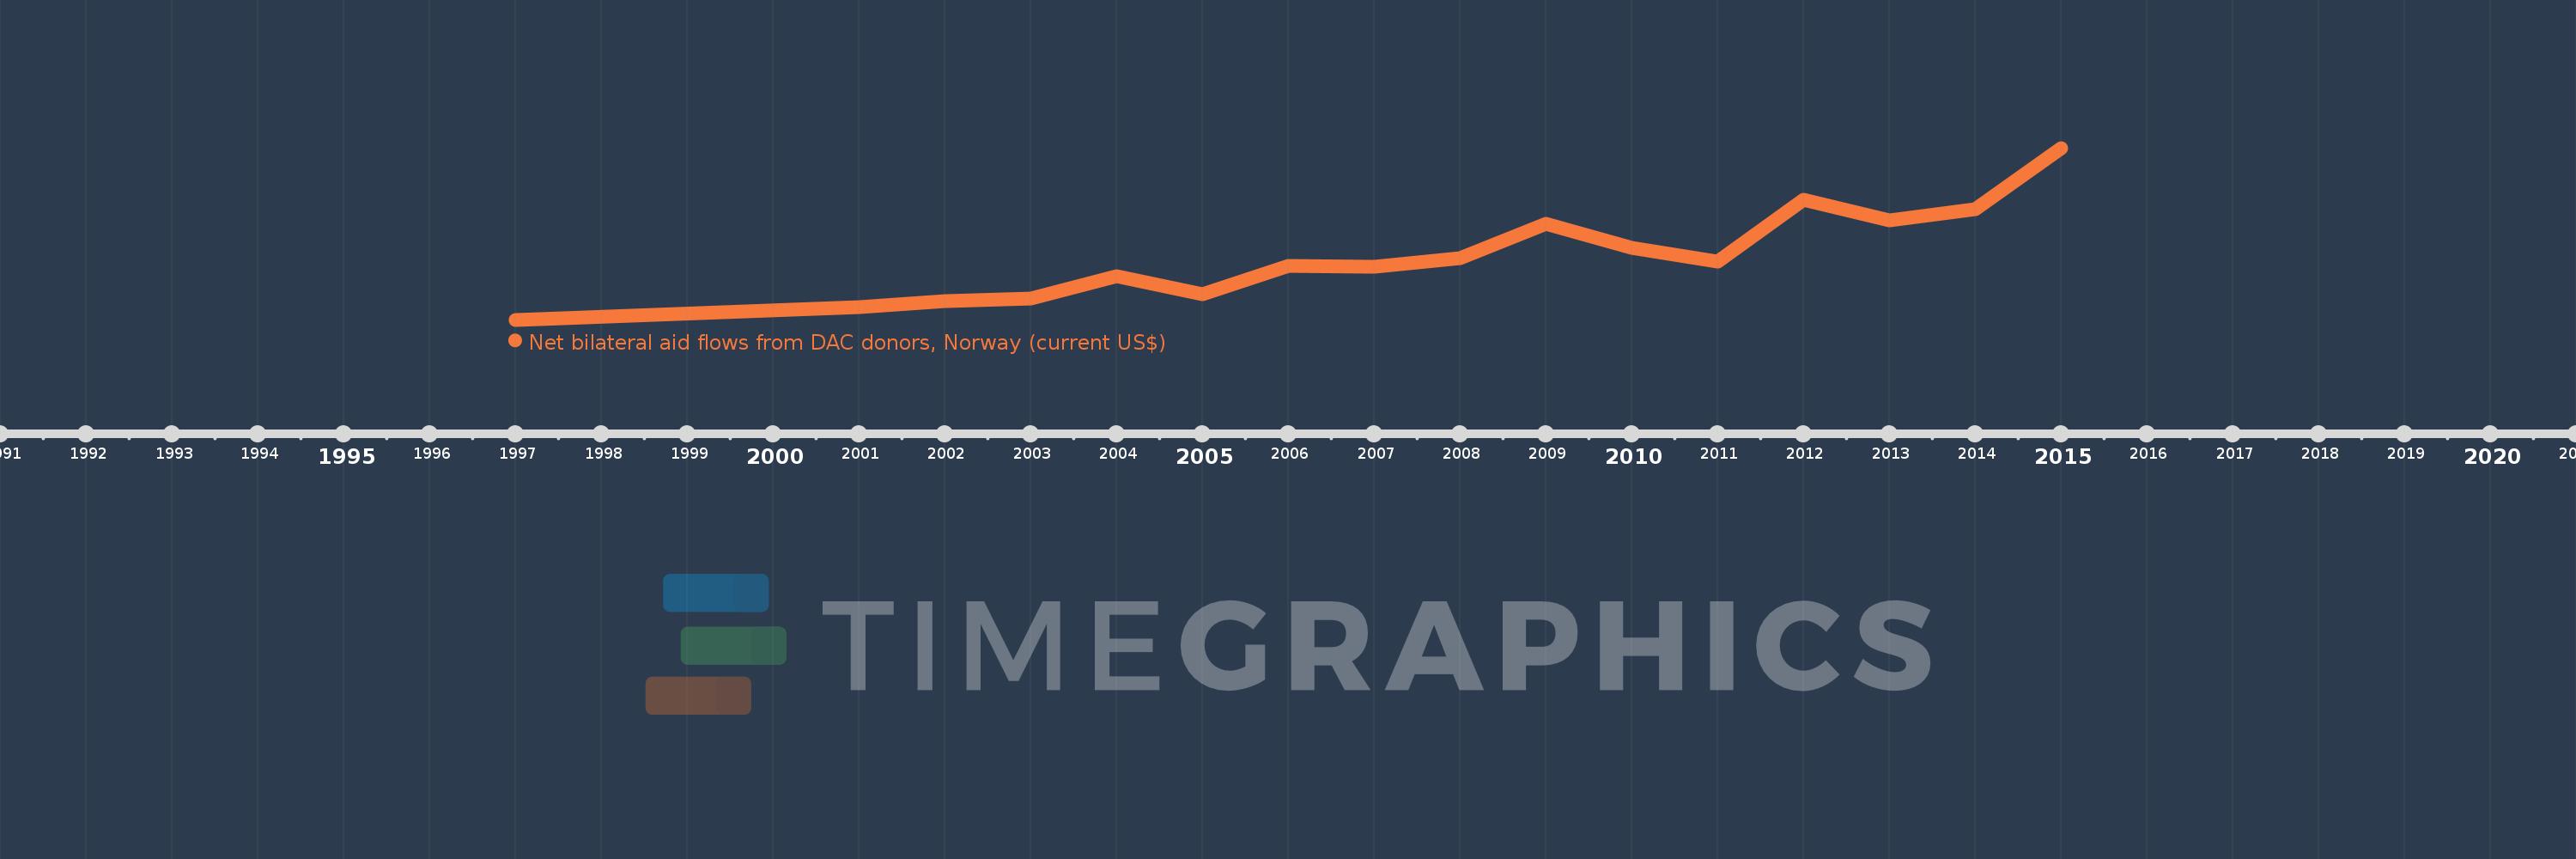
This timeline shows a graph from 1997 to 2015 of Moldova. No data until 1996. Number of actual observations by date: 16.
Source name:
World Development Indicators
Source organization:
Development Assistance Committee of the Organisation for Economic Co-operation and Development, Geographical Distribution of Financial Flows to Developing Countries, Development Co-operation Report, and International Development Statistics database. Data are available online at: www.oecd.org/dac/stats/idsonline.
Categories, topics:
Aid Effectiveness
Last updated:
apr 23, 2017
Indicators value changes by year
Meaning:
3.273 mln
Minimum:
20.0K
jan 1, 1997
Maximum:
8.81 mln
jan 1, 2015
At the date of observation
Value
Absolute change
Change from the previous value
jan 1, 1997
20.0K
+20.0K
0.0%
jan 1, 2001
650.0K
+630.0K
3.15K%
jan 1, 2002
980.0K
+330.0K
50.77%
jan 1, 2003
1.09 mln
+110.0K
11.22%
jan 1, 2004
2.27 mln
+1.18 mln
108.26%
jan 1, 2005
1.31 mln
-960.0K
-42.29%
jan 1, 2006
2.76 mln
+1.45 mln
110.69%
jan 1, 2007
2.74 mln
-20.0K
-0.72%
jan 1, 2008
3.19 mln
+450.0K
16.42%
jan 1, 2009
4.92 mln
+1.73 mln
54.23%
jan 1, 2010
3.69 mln
-1.23 mln
-25.0%
jan 1, 2011
3.0 mln
-690.0K
-18.7%
jan 1, 2012
6.16 mln
+3.16 mln
105.33%
jan 1, 2013
5.11 mln
-1.05 mln
-17.05%
jan 1, 2014
5.67 mln
+560.0K
10.96%
jan 1, 2015
8.81 mln
+3.14 mln
55.38%
Ranking of countries by current statistics by years