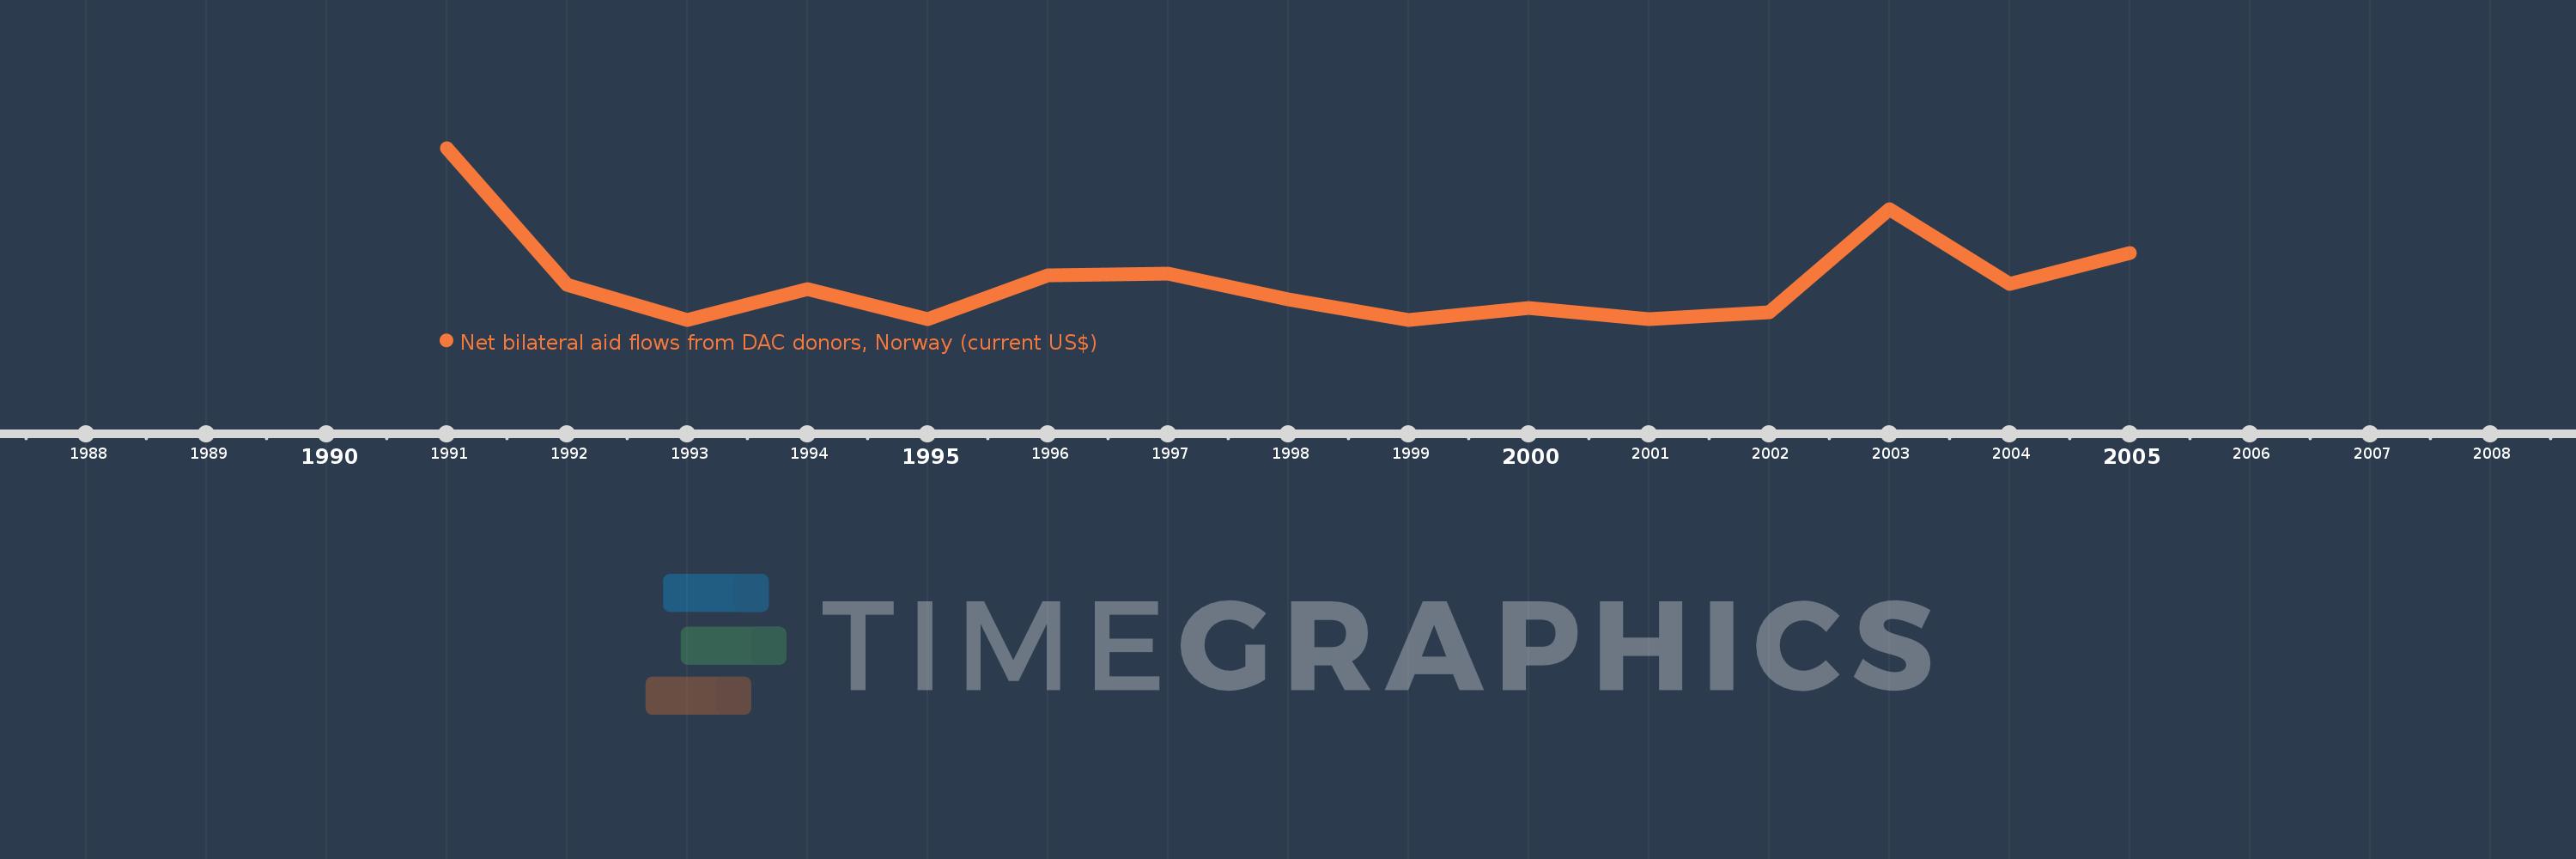
This timeline shows a graph from 1991 to 2005 of Romania. No data until 1990. Number of actual observations by date: 15.
Source name:
World Development Indicators
Source organization:
Development Assistance Committee of the Organisation for Economic Co-operation and Development, Geographical Distribution of Financial Flows to Developing Countries, Development Co-operation Report, and International Development Statistics database. Data are available online at: www.oecd.org/dac/stats/idsonline.
Categories, topics:
Aid Effectiveness
Last updated:
apr 23, 2017
Indicators value changes by year
Meaning:
483.333K
Minimum:
40.0K
jan 1, 1993
Maximum:
2.0 mln
jan 1, 1991
At the date of observation
Value
Absolute change
Change from the previous value
jan 1, 1991
2.0 mln
+2.0 mln
0.0%
jan 1, 1992
440.0K
-1.56 mln
-78.0%
jan 1, 1993
40.0K
-400.0K
-90.91%
jan 1, 1994
390.0K
+350.0K
875.0%
jan 1, 1995
50.0K
-340.0K
-87.18%
jan 1, 1996
550.0K
+500.0K
1000.0%
jan 1, 1997
570.0K
+20.0K
3.64%
jan 1, 1998
270.0K
-300.0K
-52.63%
jan 1, 1999
40.0K
-230.0K
-85.19%
jan 1, 2000
170.0K
+130.0K
325.0%
jan 1, 2001
50.0K
-120.0K
-70.59%
jan 1, 2002
130.0K
+80.0K
160.0%
jan 1, 2003
1.3 mln
+1.17 mln
900.0%
jan 1, 2004
450.0K
-850.0K
-65.38%
jan 1, 2005
800.0K
+350.0K
77.78%
Ranking of countries by current statistics by years