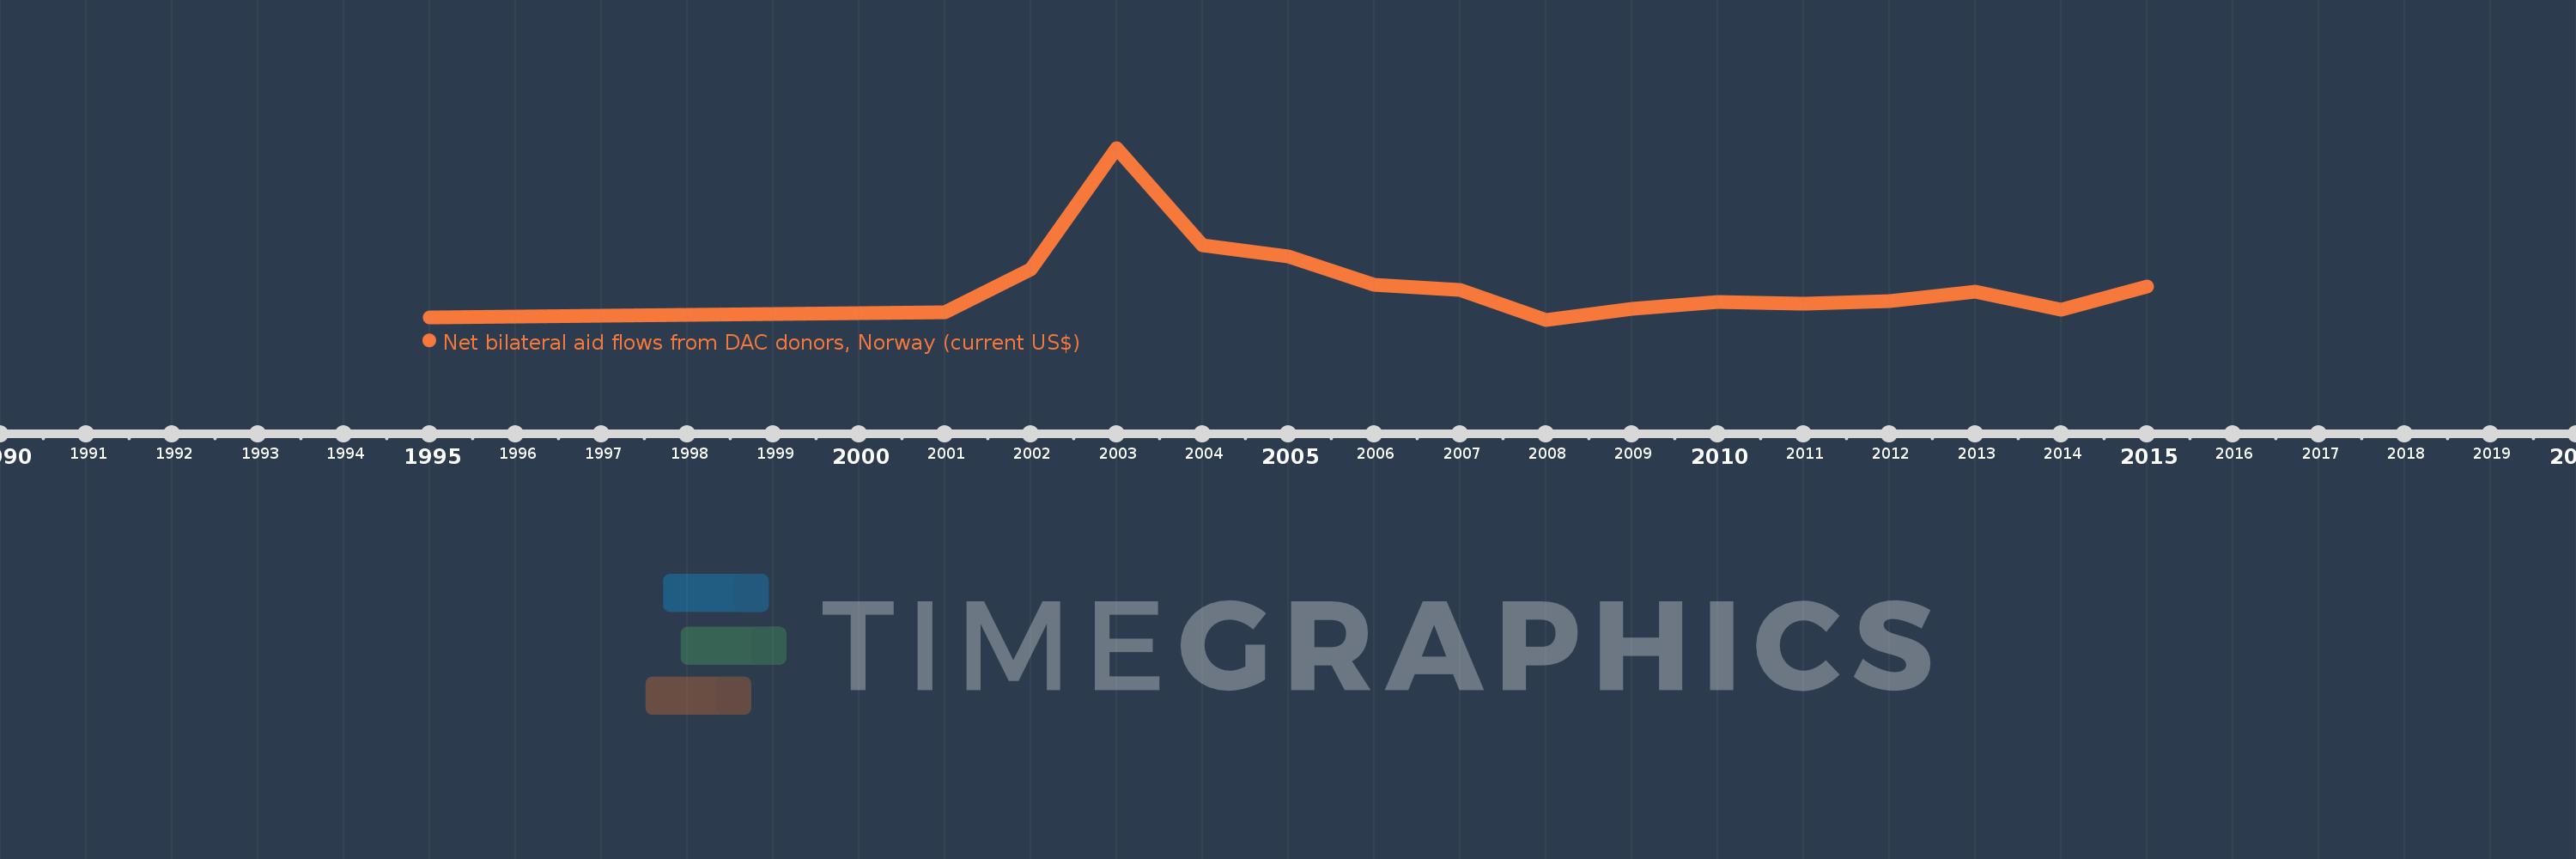
This timeline shows a graph from 1995 to 2015 of Uzbekistan. No data until 1994. Number of actual observations by date: 16.
Source name:
World Development Indicators
Source organization:
Development Assistance Committee of the Organisation for Economic Co-operation and Development, Geographical Distribution of Financial Flows to Developing Countries, Development Co-operation Report, and International Development Statistics database. Data are available online at: www.oecd.org/dac/stats/idsonline.
Categories, topics:
Aid Effectiveness
Last updated:
apr 23, 2017
Indicators value changes by year
Meaning:
544.375K
Minimum:
10.0K
jan 1, 2008
Maximum:
2.59 mln
jan 1, 2003
At the date of observation
Value
Absolute change
Change from the previous value
jan 1, 1995
50.0K
+50.0K
0.0%
jan 1, 2001
120.0K
+70.0K
140.0%
jan 1, 2002
770.0K
+650.0K
541.67%
jan 1, 2003
2.59 mln
+1.82 mln
236.36%
jan 1, 2004
1.13 mln
-1.46 mln
-56.37%
jan 1, 2005
960.0K
-170.0K
-15.04%
jan 1, 2006
530.0K
-430.0K
-44.79%
jan 1, 2007
460.0K
-70.0K
-13.21%
jan 1, 2008
10.0K
-450.0K
-97.83%
jan 1, 2009
170.0K
+160.0K
1.6K%
jan 1, 2010
280.0K
+110.0K
64.71%
jan 1, 2011
250.0K
-30.0K
-10.71%
jan 1, 2012
290.0K
+40.0K
16.0%
jan 1, 2013
430.0K
+140.0K
48.28%
jan 1, 2014
160.0K
-270.0K
-62.79%
jan 1, 2015
510.0K
+350.0K
218.75%
Ranking of countries by current statistics by years