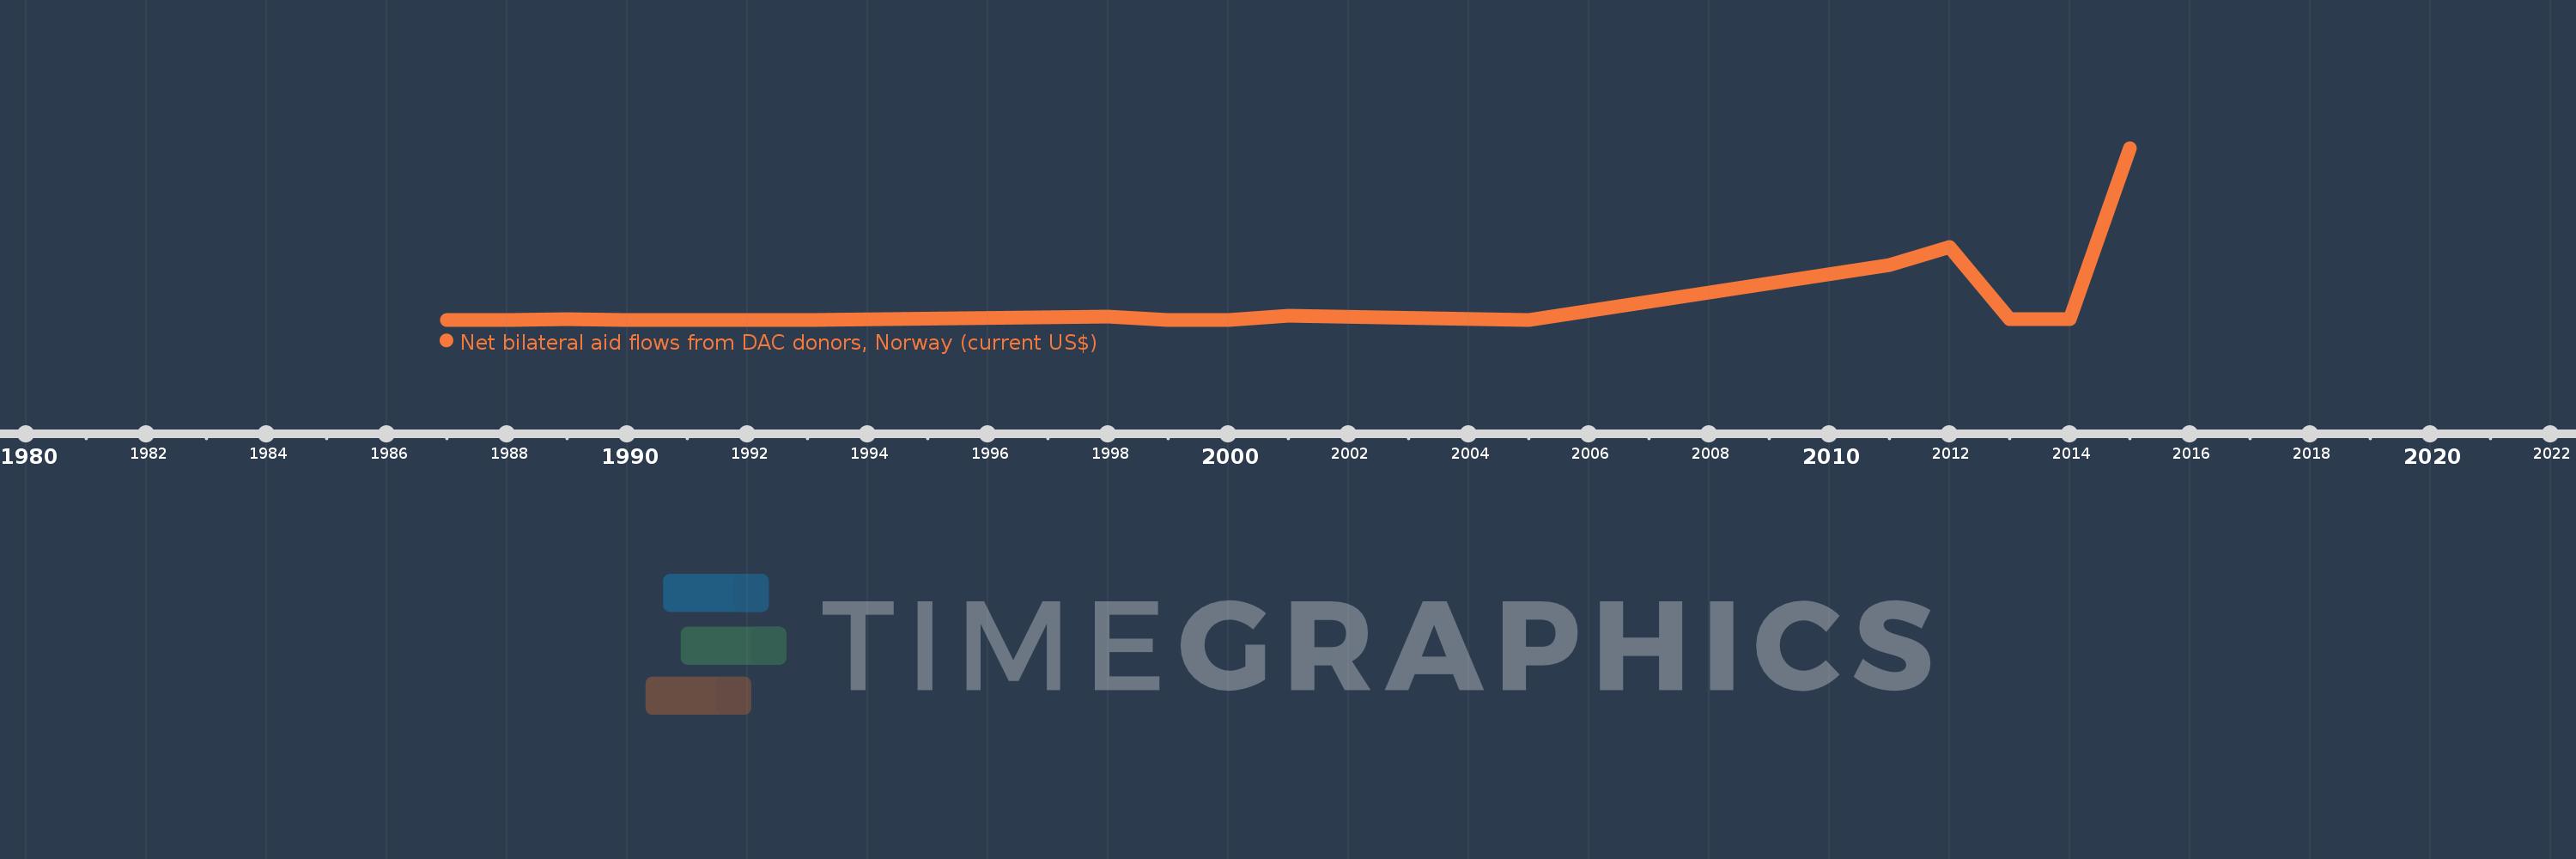
This timeline shows a graph from 1987 to 2015 of Guyana. No data until 1986. Number of actual observations by date: 17.
Source name:
World Development Indicators
Source organization:
Development Assistance Committee of the Organisation for Economic Co-operation and Development, Geographical Distribution of Financial Flows to Developing Countries, Development Co-operation Report, and International Development Statistics database. Data are available online at: www.oecd.org/dac/stats/idsonline.
Categories, topics:
Aid Effectiveness
Last updated:
apr 23, 2017
Indicators value changes by year
Meaning:
9.756 mln
Minimum:
20.0K
jan 1, 1987
Maximum:
92.32 mln
jan 1, 2015
At the date of observation
Value
Absolute change
Change from the previous value
jan 1, 1987
20.0K
+20.0K
0.0%
jan 1, 1988
20.0K
0.0
0.0%
jan 1, 1989
260.0K
+240.0K
1.2K%
jan 1, 1990
80.0K
-180.0K
-69.23%
jan 1, 1991
50.0K
-30.0K
-37.5%
jan 1, 1992
50.0K
0.0
0.0%
jan 1, 1993
60.0K
+10.0K
20.0%
jan 1, 1998
1.66 mln
+1.6 mln
2.67K%
jan 1, 1999
80.0K
-1.58 mln
-95.18%
jan 1, 2000
70.0K
-10.0K
-12.5%
jan 1, 2001
2.3 mln
+2.23 mln
3.19K%
jan 1, 2005
30.0K
-2.27 mln
-98.7%
jan 1, 2011
29.23 mln
+29.2 mln
97.33K%
jan 1, 2012
39.07 mln
+9.84 mln
33.66%
jan 1, 2013
390.0K
-38.68 mln
-99.0%
jan 1, 2014
160.0K
-230.0K
-58.97%
jan 1, 2015
92.32 mln
+92.16 mln
57.6K%
Ranking of countries by current statistics by years