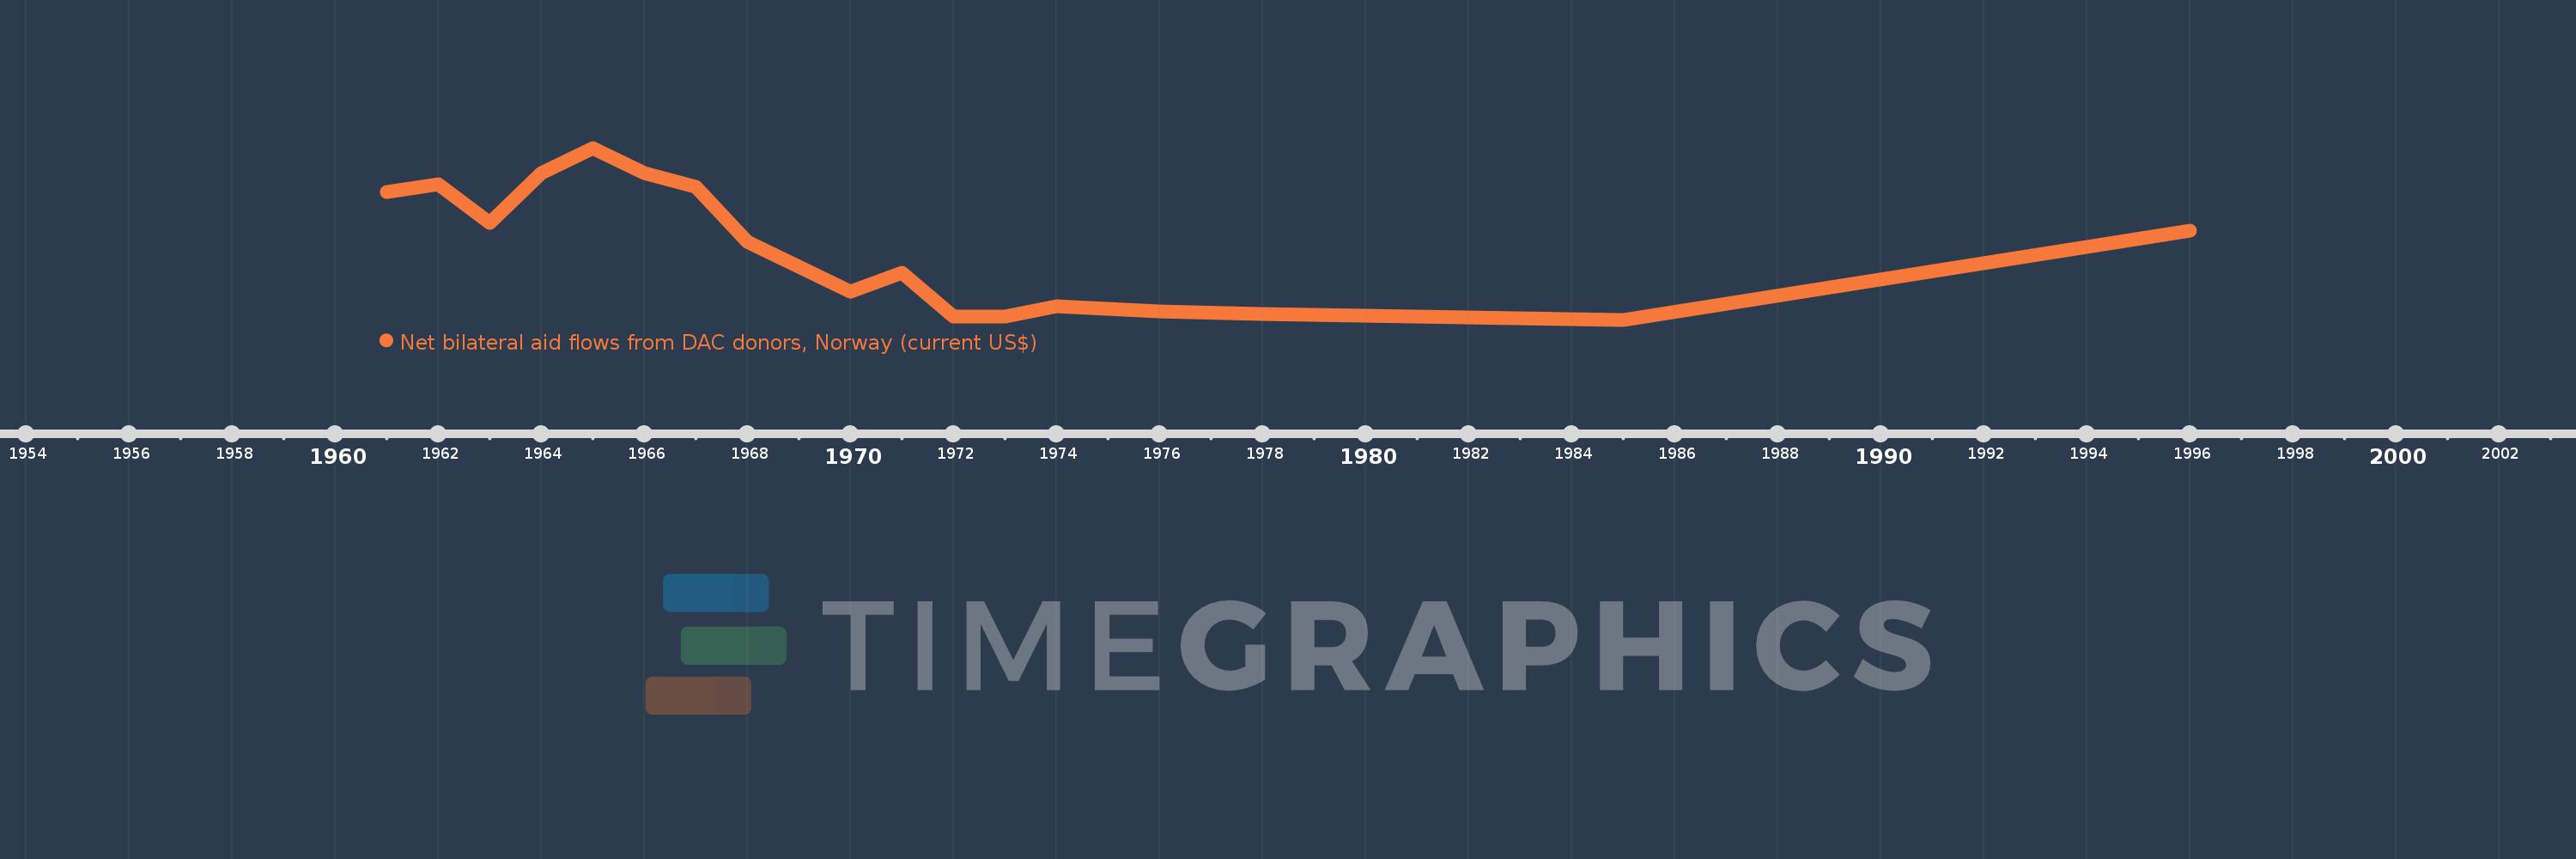
This timeline shows a graph from 1961 to 1996 of Korea, Rep.. No data until 1960. Number of actual observations by date: 19.
Source name:
World Development Indicators
Source organization:
Development Assistance Committee of the Organisation for Economic Co-operation and Development, Geographical Distribution of Financial Flows to Developing Countries, Development Co-operation Report, and International Development Statistics database. Data are available online at: www.oecd.org/dac/stats/idsonline.
Categories, topics:
Aid Effectiveness
Last updated:
apr 23, 2017
Indicators value changes by year
Meaning:
256.316K
Minimum:
10.0K
jan 1, 1985
Maximum:
630.0K
jan 1, 1965
At the date of observation
Value
Absolute change
Change from the previous value
jan 1, 1961
470.0K
+470.0K
0.0%
jan 1, 1962
500.0K
+30.0K
6.38%
jan 1, 1963
360.0K
-140.0K
-28.0%
jan 1, 1964
540.0K
+180.0K
50.0%
jan 1, 1965
630.0K
+90.0K
16.67%
jan 1, 1966
540.0K
-90.0K
-14.29%
jan 1, 1967
490.0K
-50.0K
-9.26%
jan 1, 1968
290.0K
-200.0K
-40.82%
jan 1, 1969
200.0K
-90.0K
-31.03%
jan 1, 1970
110.0K
-90.0K
-45.0%
jan 1, 1971
180.0K
+70.0K
63.64%
jan 1, 1972
20.0K
-160.0K
-88.89%
jan 1, 1973
20.0K
0.0
0.0%
jan 1, 1974
60.0K
+40.0K
200.0%
jan 1, 1975
50.0K
-10.0K
-16.67%
jan 1, 1976
40.0K
-10.0K
-20.0%
jan 1, 1978
30.0K
-10.0K
-25.0%
jan 1, 1985
10.0K
-20.0K
-66.67%
jan 1, 1996
330.0K
+320.0K
3.2K%
Ranking of countries by current statistics by years