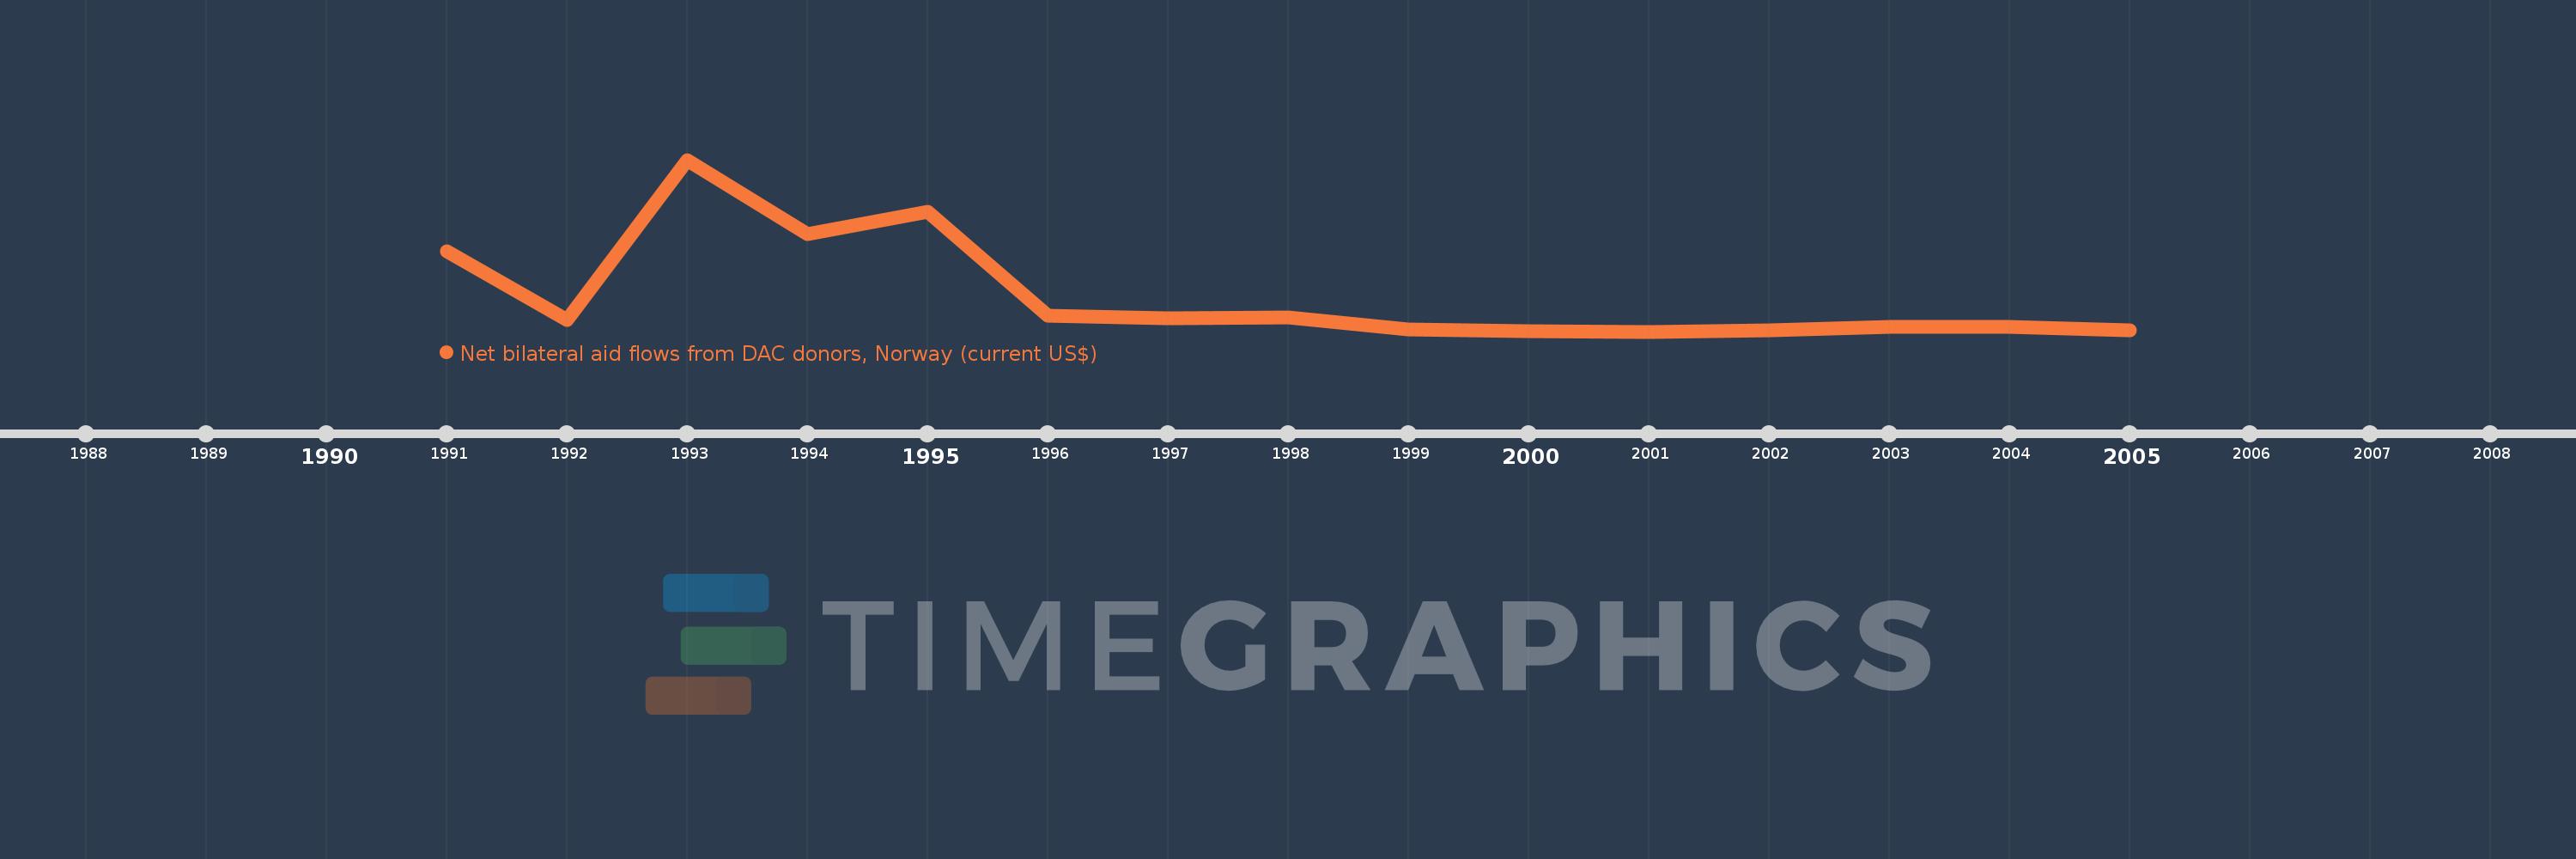
This timeline shows a graph from 1991 to 2005 of Poland. No data until 1990. Number of actual observations by date: 15.
Source name:
World Development Indicators
Source organization:
Development Assistance Committee of the Organisation for Economic Co-operation and Development, Geographical Distribution of Financial Flows to Developing Countries, Development Co-operation Report, and International Development Statistics database. Data are available online at: www.oecd.org/dac/stats/idsonline.
Categories, topics:
Aid Effectiveness
Last updated:
apr 23, 2017
Indicators value changes by year
Meaning:
7.779 mln
Minimum:
30.0K
jan 1, 2001
Maximum:
37.06 mln
jan 1, 1993
At the date of observation
Value
Absolute change
Change from the previous value
jan 1, 1991
17.4 mln
+17.4 mln
0.0%
jan 1, 1992
2.59 mln
-14.81 mln
-85.11%
jan 1, 1993
37.06 mln
+34.47 mln
1.33K%
jan 1, 1994
21.05 mln
-16.01 mln
-43.2%
jan 1, 1995
25.79 mln
+4.74 mln
22.52%
jan 1, 1996
3.38 mln
-22.41 mln
-86.89%
jan 1, 1997
2.96 mln
-420.0K
-12.43%
jan 1, 1998
3.0 mln
+40.0K
1.35%
jan 1, 1999
580.0K
-2.42 mln
-80.67%
jan 1, 2000
100.0K
-480.0K
-82.76%
jan 1, 2001
30.0K
-70.0K
-70.0%
jan 1, 2002
260.0K
+230.0K
766.67%
jan 1, 2003
1.06 mln
+800.0K
307.69%
jan 1, 2004
1.02 mln
-40.0K
-3.77%
jan 1, 2005
400.0K
-620.0K
-60.78%
Ranking of countries by current statistics by years