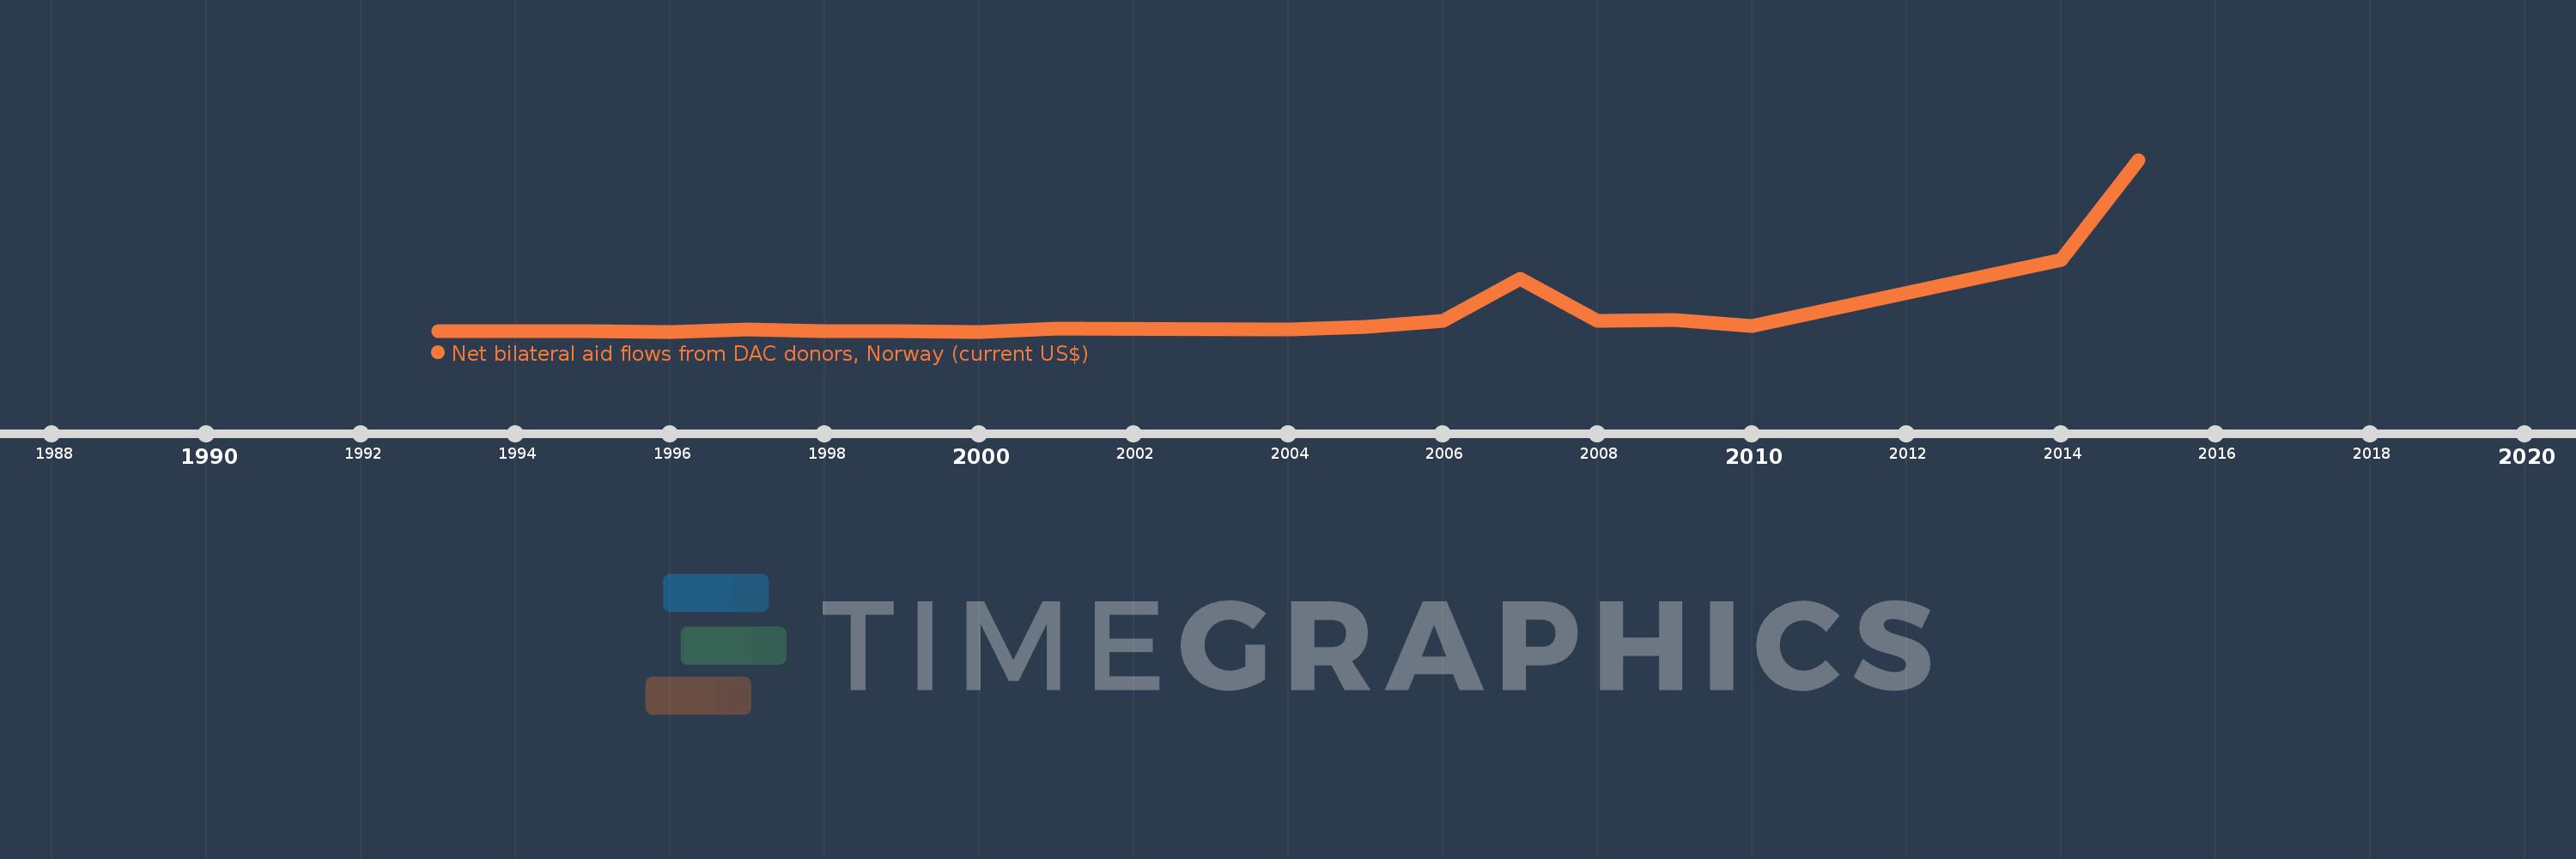
This timeline shows a graph from 1993 to 2015 of Central African Republic. No data until 1992. Number of actual observations by date: 17.
Source name:
World Development Indicators
Source organization:
Development Assistance Committee of the Organisation for Economic Co-operation and Development, Geographical Distribution of Financial Flows to Developing Countries, Development Co-operation Report, and International Development Statistics database. Data are available online at: www.oecd.org/dac/stats/idsonline.
Categories, topics:
Aid Effectiveness
Last updated:
apr 23, 2017
Indicators value changes by year
Meaning:
2.204 mln
Minimum:
10.0K
jan 1, 1996
Maximum:
18.46 mln
jan 1, 2015
At the date of observation
Value
Absolute change
Change from the previous value
jan 1, 1993
30.0K
+30.0K
0.0%
jan 1, 1995
20.0K
-10.0K
-33.33%
jan 1, 1996
10.0K
-10.0K
-50.0%
jan 1, 1997
270.0K
+260.0K
2.6K%
jan 1, 1998
60.0K
-210.0K
-77.78%
jan 1, 1999
20.0K
-40.0K
-66.67%
jan 1, 2000
10.0K
-10.0K
-50.0%
jan 1, 2001
320.0K
+310.0K
3.1K%
jan 1, 2004
220.0K
-100.0K
-31.25%
jan 1, 2005
490.0K
+270.0K
122.73%
jan 1, 2006
1.2 mln
+710.0K
144.9%
jan 1, 2007
5.64 mln
+4.44 mln
370.0%
jan 1, 2008
1.15 mln
-4.49 mln
-79.61%
jan 1, 2009
1.23 mln
+80.0K
6.96%
jan 1, 2010
640.0K
-590.0K
-47.97%
jan 1, 2014
7.7 mln
+7.06 mln
1.1K%
jan 1, 2015
18.46 mln
+10.76 mln
139.74%
Ranking of countries by current statistics by years