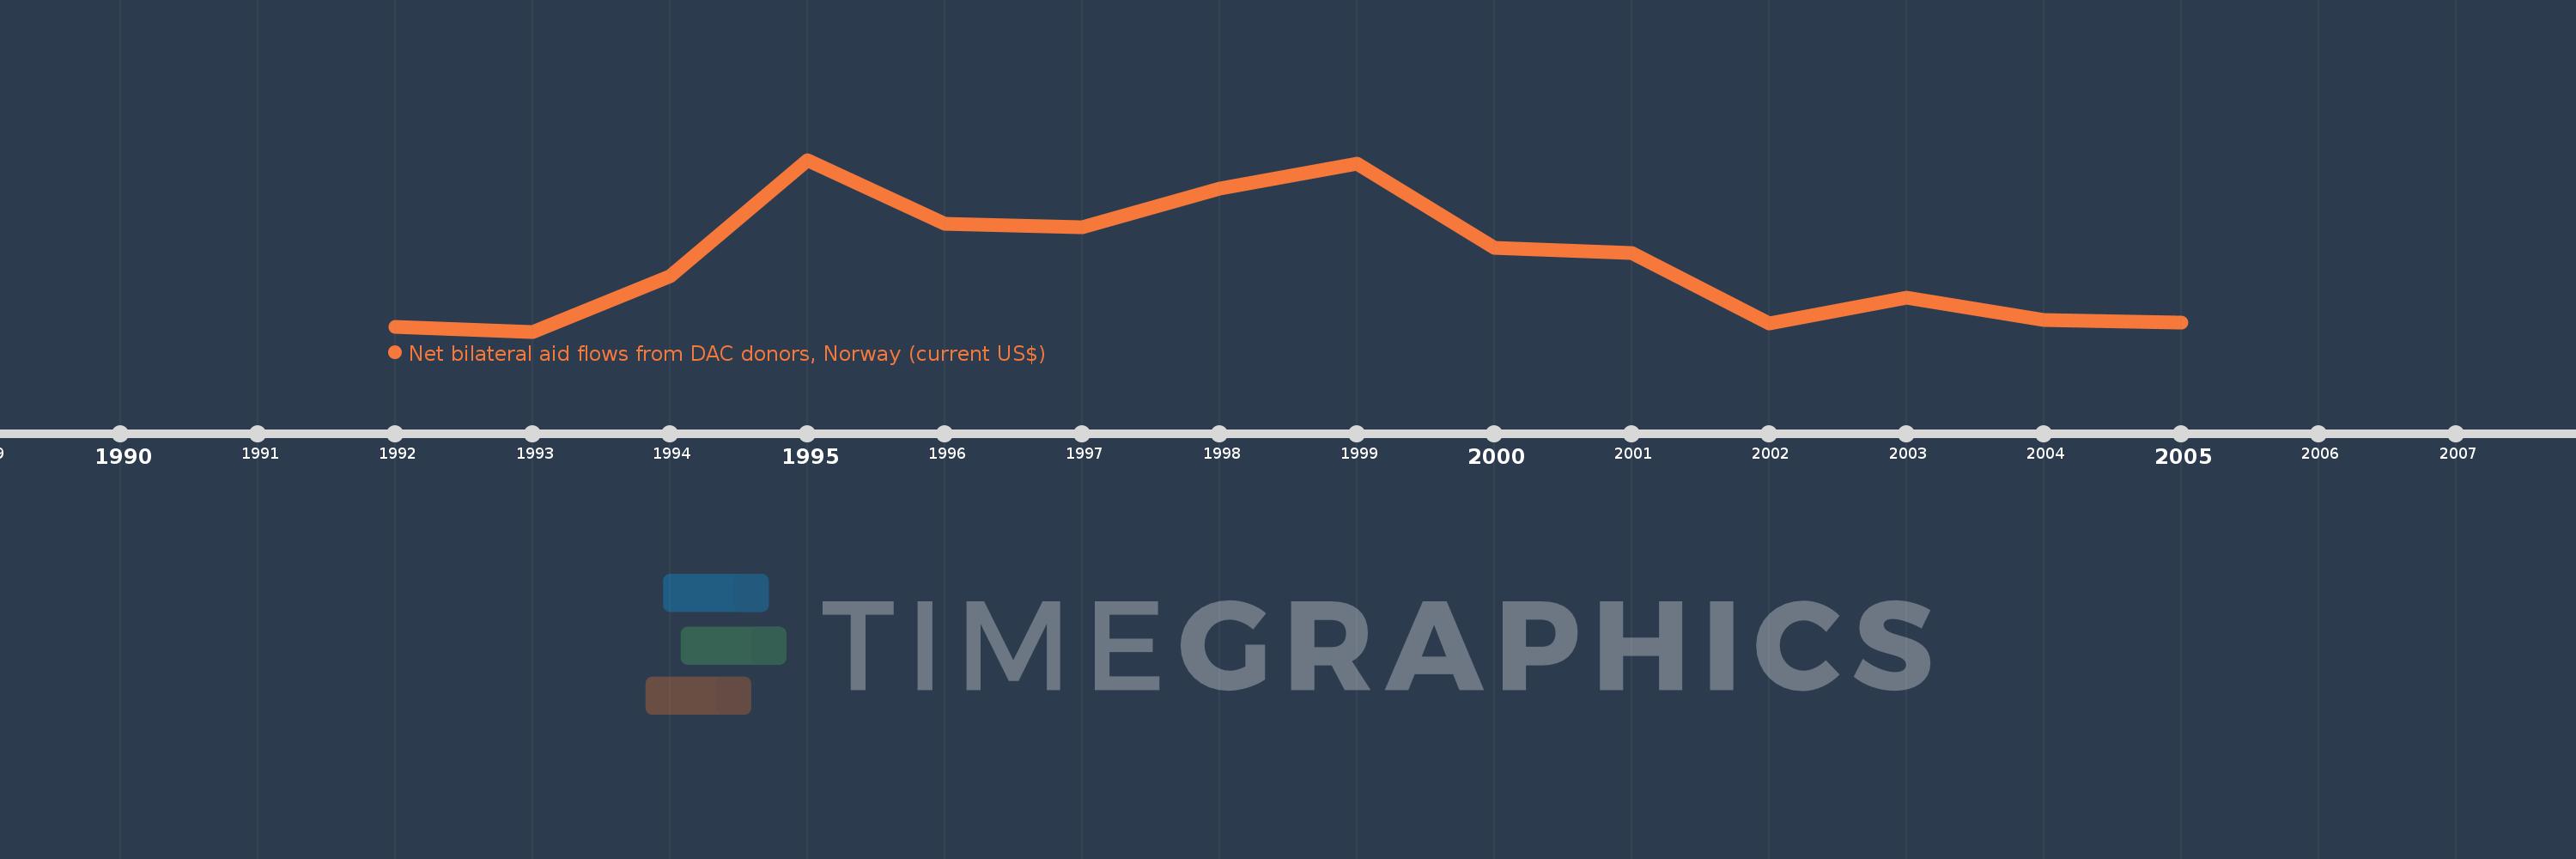
This timeline shows a graph from 1992 to 2005 of Lithuania. No data until 1991. Number of actual observations by date: 14.
Source name:
World Development Indicators
Source organization:
Development Assistance Committee of the Organisation for Economic Co-operation and Development, Geographical Distribution of Financial Flows to Developing Countries, Development Co-operation Report, and International Development Statistics database. Data are available online at: www.oecd.org/dac/stats/idsonline.
Categories, topics:
Aid Effectiveness
Last updated:
apr 23, 2017
Indicators value changes by year
Meaning:
1.586 mln
Minimum:
440.0K
jan 1, 1993
Maximum:
3.25 mln
jan 1, 1995
At the date of observation
Value
Absolute change
Change from the previous value
jan 1, 1992
520.0K
+520.0K
0.0%
jan 1, 1993
440.0K
-80.0K
-15.38%
jan 1, 1994
1.34 mln
+900.0K
204.55%
jan 1, 1995
3.25 mln
+1.91 mln
142.54%
jan 1, 1996
2.2 mln
-1.05 mln
-32.31%
jan 1, 1997
2.15 mln
-50.0K
-2.27%
jan 1, 1998
2.78 mln
+630.0K
29.3%
jan 1, 1999
3.19 mln
+410.0K
14.75%
jan 1, 2000
1.81 mln
-1.38 mln
-43.26%
jan 1, 2001
1.73 mln
-80.0K
-4.42%
jan 1, 2002
570.0K
-1.16 mln
-67.05%
jan 1, 2003
1000.0K
+430.0K
75.44%
jan 1, 2004
630.0K
-370.0K
-37.0%
jan 1, 2005
590.0K
-40.0K
-6.35%
Ranking of countries by current statistics by years