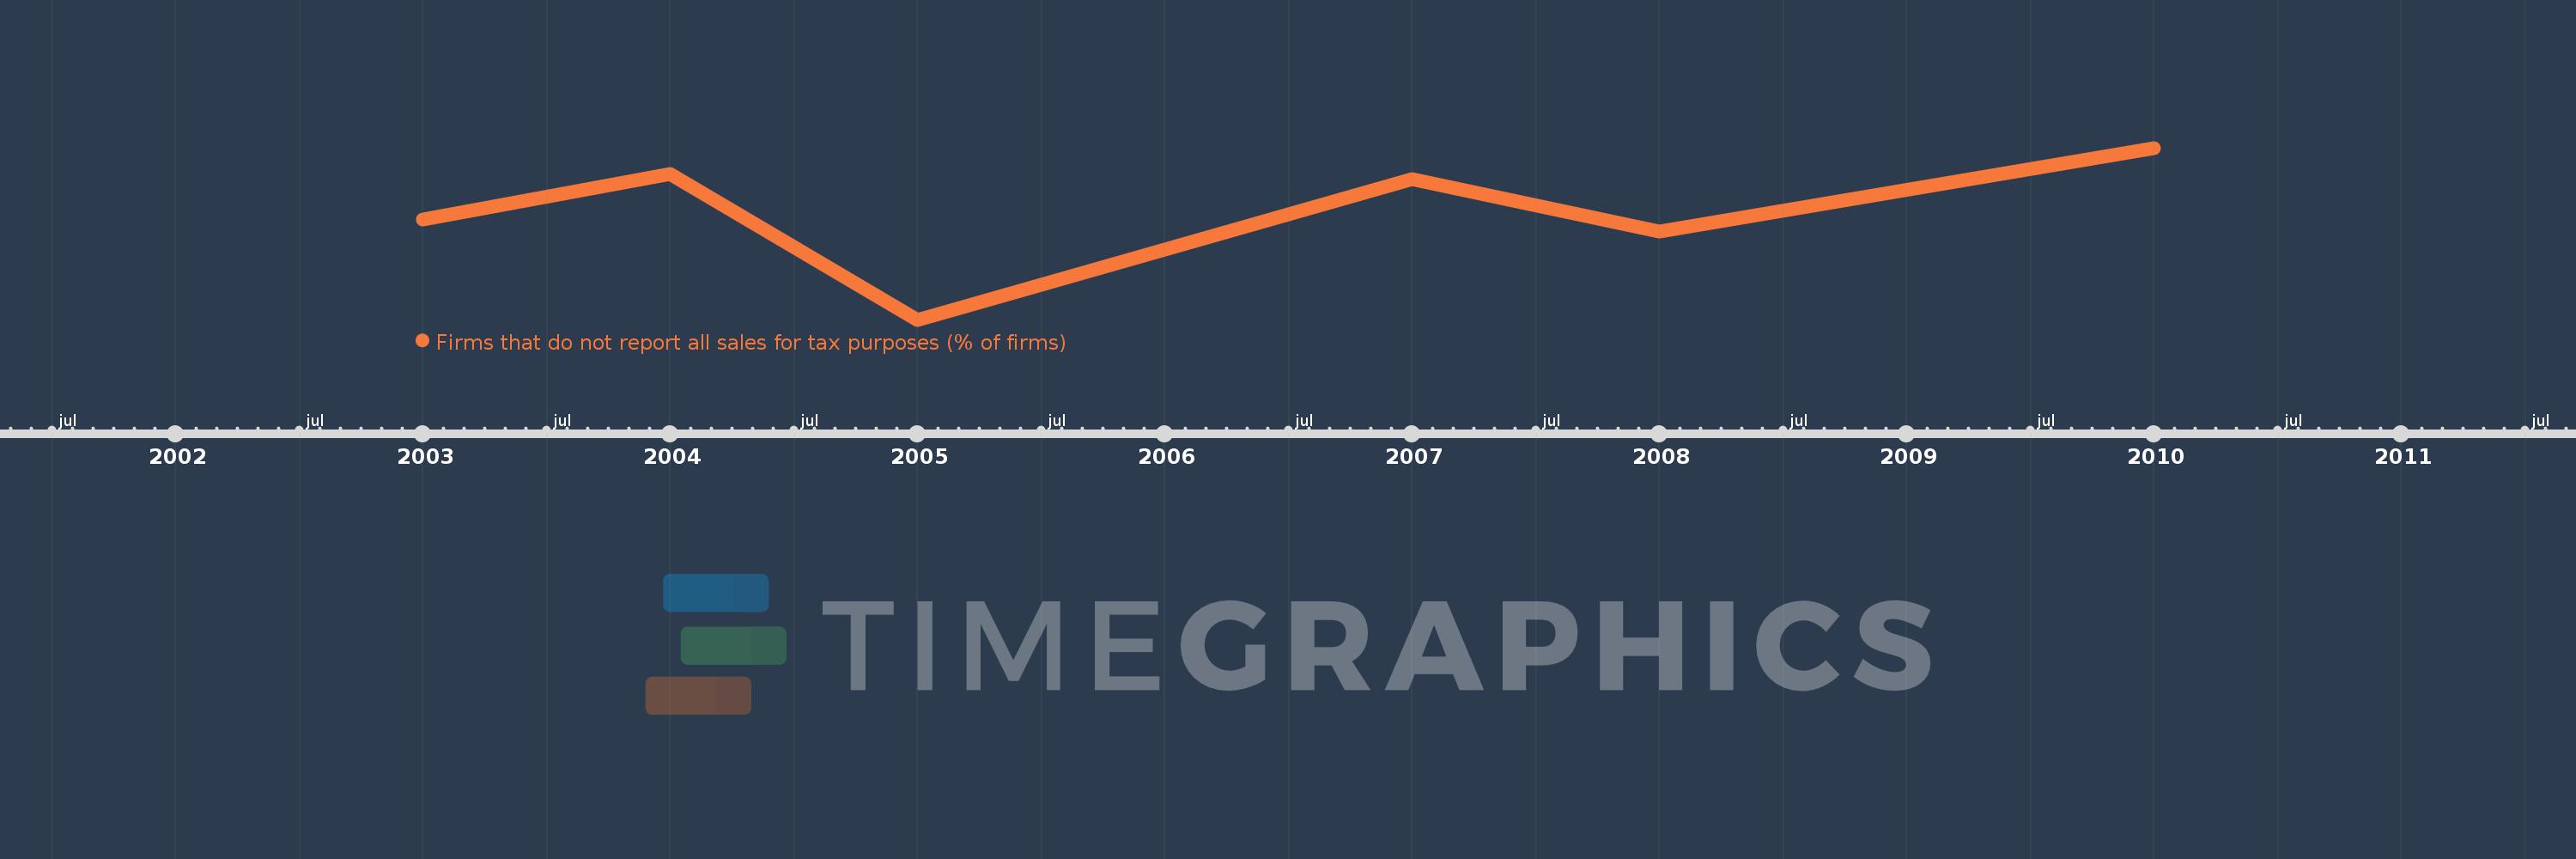
This timeline shows a graph from 2003 to 2010 of Sub-Saharan Africa (excluding high income). No data until 2002. Number of actual observations by date: 6.
Source name:
World Development Indicators
Source organization:
World Bank, Enterprise Surveys (http://www.enterprisesurveys.org/).
Categories, topics:
Private Sector
Last updated:
apr 23, 2017
Indicators value changes by year
Meaning:
54.53
Minimum:
39.55
jan 1, 2005
Maximum:
63.427
jan 1, 2010
At the date of observation
Value
Absolute change
Change from the previous value
jan 1, 2003
53.5
+53.5
0.0%
jan 1, 2004
59.79
+6.29
11.76%
jan 1, 2005
39.55
-20.24
-33.85%
jan 1, 2007
59.129
+19.579
49.51%
jan 1, 2008
51.783
-7.347
-12.42%
jan 1, 2010
63.427
+11.644
22.49%
Ranking of countries by current statistics by years