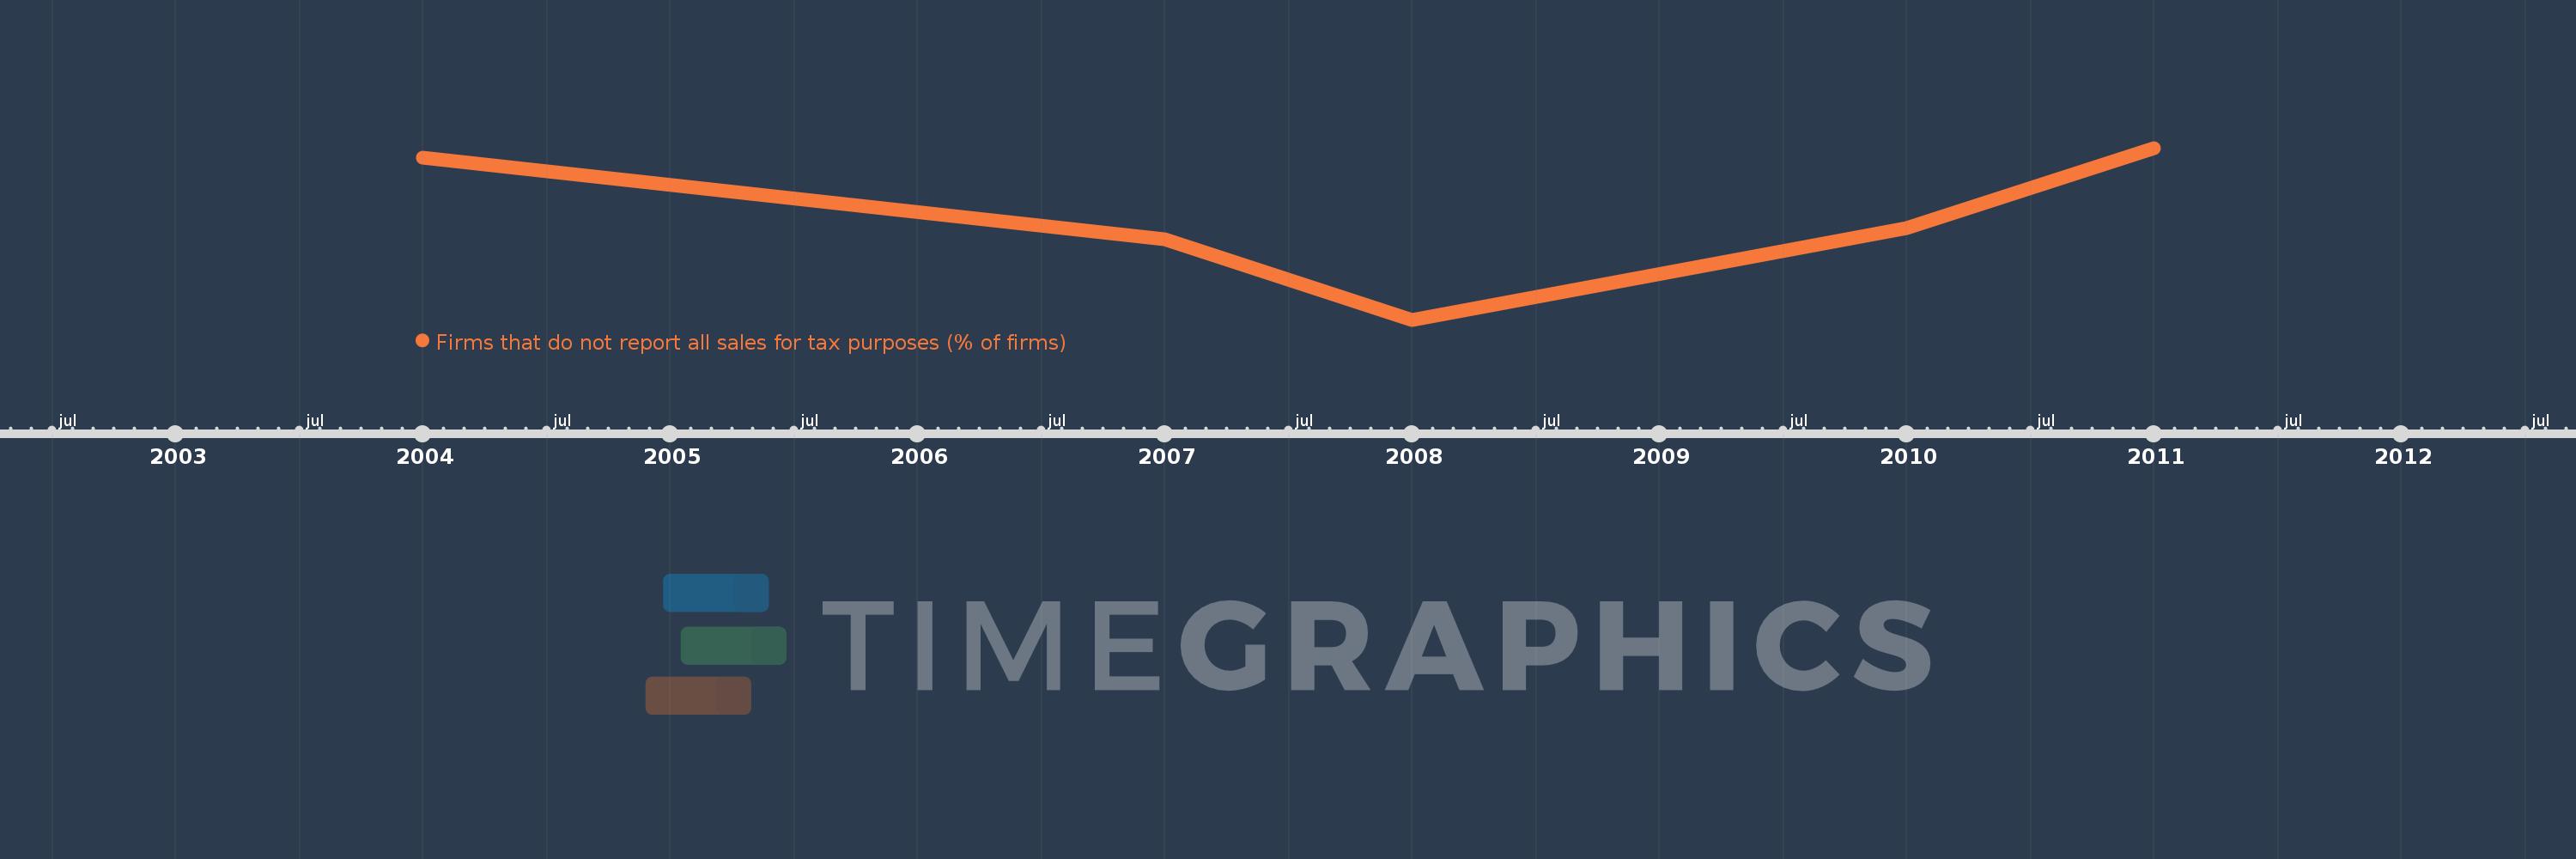
This timeline shows a graph from 2004 to 2011 of Fragile and conflict affected situations. No data until 2003. Number of actual observations by date: 5.
Source name:
World Development Indicators
Source organization:
World Bank, Enterprise Surveys (http://www.enterprisesurveys.org/).
Categories, topics:
Private Sector
Last updated:
apr 23, 2017
Indicators value changes by year
Meaning:
64.798
Minimum:
39.71
jan 1, 2008
Maximum:
82.33
jan 1, 2011
At the date of observation
Value
Absolute change
Change from the previous value
jan 1, 2004
79.87
+79.87
0.0%
jan 1, 2007
59.59
-20.28
-25.39%
jan 1, 2008
39.71
-19.88
-33.36%
jan 1, 2010
62.492
+22.782
57.37%
jan 1, 2011
82.33
+19.838
31.75%
Ranking of countries by current statistics by years