33
/
AIzaSyB4mHJ5NPEv-XzF7P6NDYXjlkCWaeKw5bc
November 30, 2025
37331
IDA & IBRD total
IBT
false
2
1
Firms that do not report all sales for tax purposes (% of firms)
2011,2010,2009,2008,2007,2006,2005,2004,2003
Create a timeline
Public Timelines
For education
For educational institutions
For teachers
For students
Cabinet
For educational institutions
For teachers
For students
Open cabinet
FAQ
Close
Create a timeline
Public timelines
FAQ
About & Feedback
Terms
Privacy
FAQ
Support 24/7
Cabinet
Get premium
Donate
Download
Global statistics library
→
IDA & IBRD total
→
Firms that do not report all sales for tax purposes (% of firms)
This statistics in other country:
Albania
Algeria
Angola
Arab World
Argentina
Armenia
Azerbaijan
Belarus
Benin
Bolivia
Bosnia and Herzegovina
Botswana
Bulgaria
Burkina Faso
Burundi
Cabo Verde
Cambodia
Cameroon
Caribbean small states
Central Europe and the Baltics
Chile
China
Colombia
Congo, Dem. Rep.
Congo, Rep.
Costa Rica
Cote d'Ivoire
Croatia
Czech Republic
Dominican Republic
Early-demographic dividend
East Asia & Pacific
East Asia & Pacific (excluding high income)
East Asia & Pacific (IDA & IBRD countries)
Ecuador
Egypt, Arab Rep.
El Salvador
Estonia
Ethiopia
Euro area
Europe & Central Asia
Europe & Central Asia (excluding high income)
Europe & Central Asia (IDA & IBRD countries)
European Union
Fragile and conflict affected situations
Gabon
Gambia, The
Georgia
Ghana
Greece
Guatemala
Guinea
Guinea-Bissau
Guyana
Heavily indebted poor countries (HIPC)
High income
Honduras
Hungary
IBRD only
IDA & IBRD total
IDA blend
IDA only
IDA total
India
Indonesia
Ireland
Jamaica
Jordan
Kazakhstan
Kenya
Korea, Rep.
Kyrgyz Republic
Lao PDR
Late-demographic dividend
Latin America & Caribbean
Latin America & Caribbean (excluding high income)
Latin America & the Caribbean (IDA & IBRD countries)
Latvia
Least developed countries: UN classification
Lebanon
Liberia
Lithuania
Low & middle income
Low income
Lower middle income
Macedonia, FYR
Madagascar
Malawi
Mali
Mauritania
Mauritius
Mexico
Middle East & North Africa
Middle East & North Africa (excluding high income)
Middle East & North Africa (IDA & IBRD countries)
Middle income
Moldova
Mongolia
Montenegro
Mozambique
Namibia
Nicaragua
Niger
Nigeria
OECD members
Oman
Other small states
Pakistan
Panama
Paraguay
Peru
Poland
Portugal
Post-demographic dividend
Pre-demographic dividend
Romania
Russian Federation
Rwanda
Senegal
Serbia
Sierra Leone
Slovak Republic
Slovenia
Small states
South Africa
South Asia
South Asia (IDA & IBRD)
Spain
Sri Lanka
Sub-Saharan Africa
Sub-Saharan Africa (excluding high income)
Sub-Saharan Africa (IDA & IBRD countries)
Swaziland
Syrian Arab Republic
Tajikistan
Tanzania
Turkey
Uganda
Ukraine
Upper middle income
Uruguay
Uzbekistan
Vietnam
West Bank and Gaza
World
Yemen, Rep.
Zambia
Timeline:
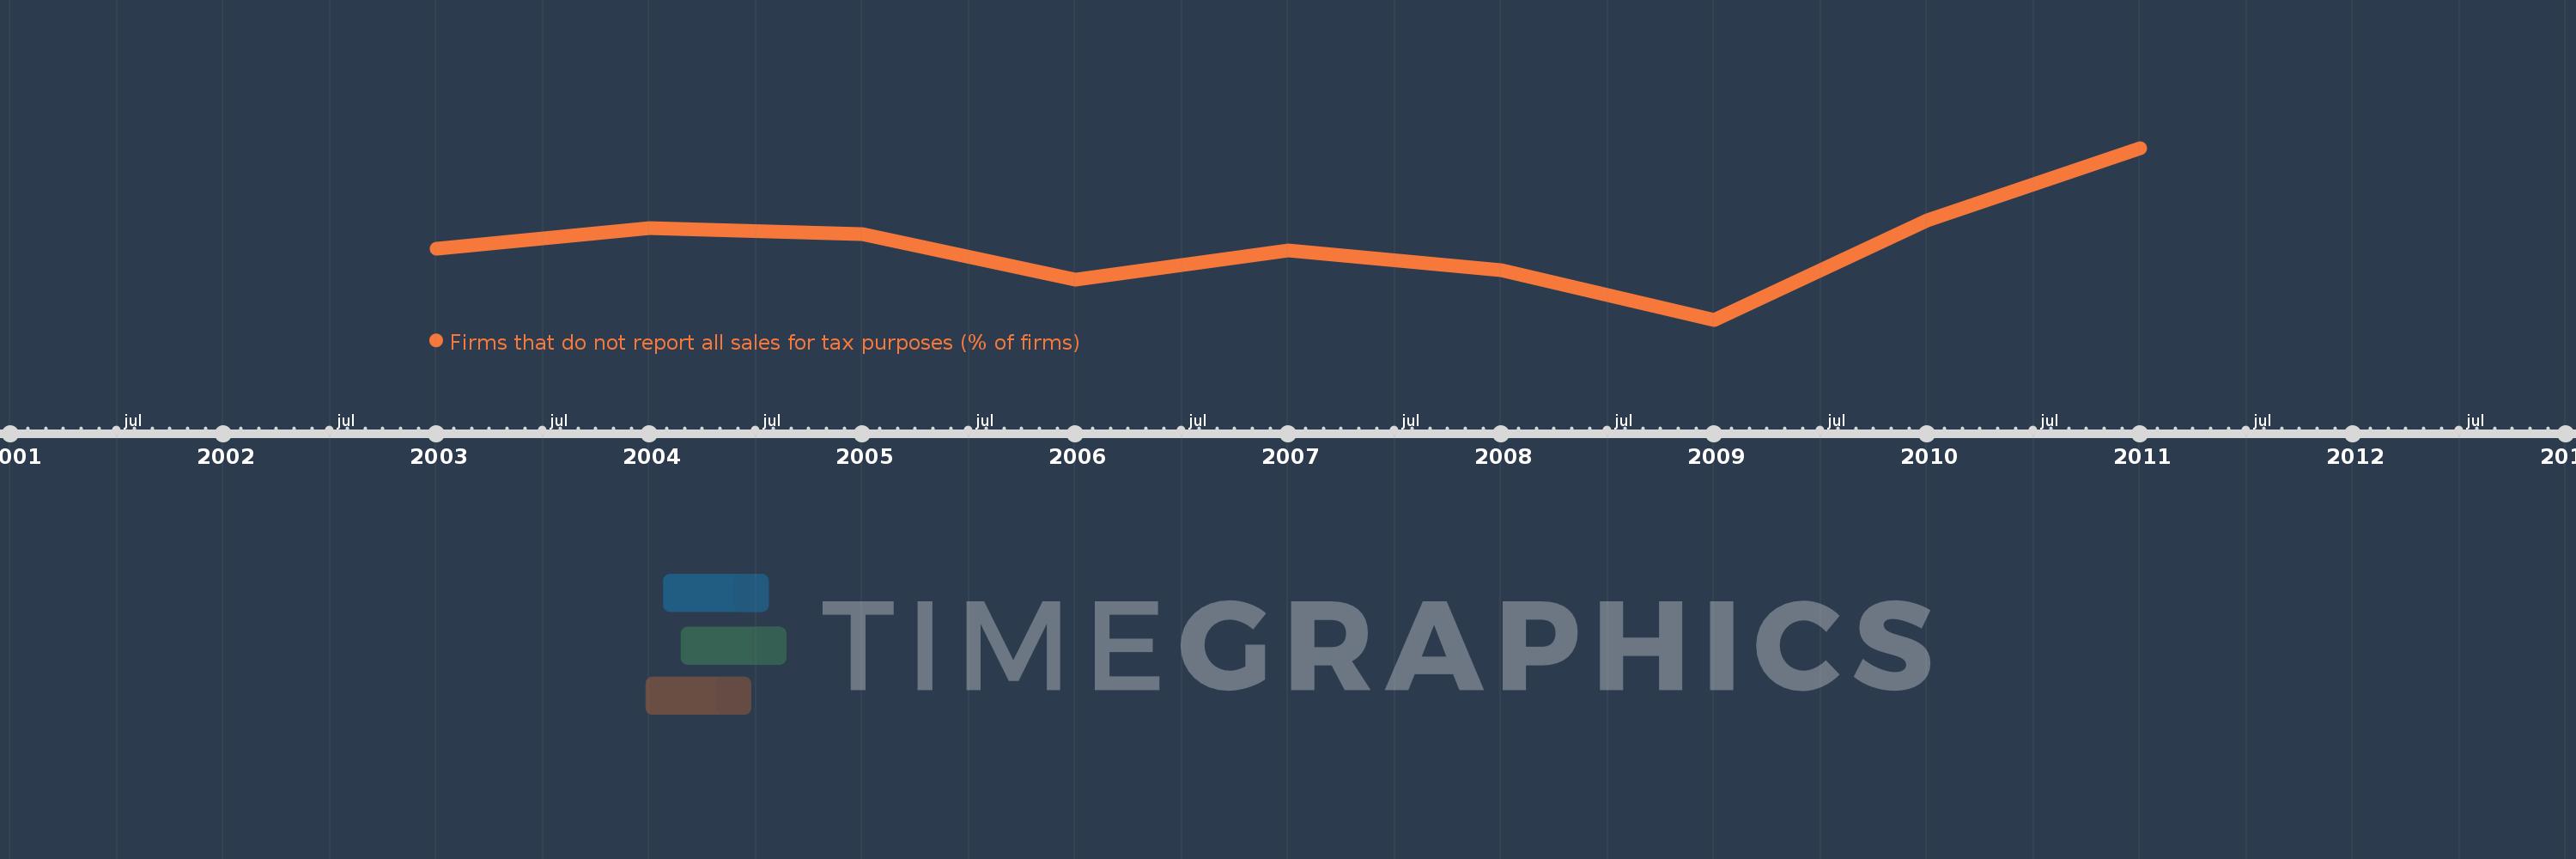
This timeline shows a graph from
2003
to
2011
of IDA & IBRD total. No data until
2002
. Number of actual observations by date:
9
.
Source name:
World Development Indicators
Source organization:
World Bank, Enterprise Surveys (http://www.enterprisesurveys.org/).
Categories, topics:
Private Sector
Last updated:
apr 23, 2017
Indicators value changes by year
Meaning:
52.937
Minimum:
30.0
jan 1, 2009
Maximum:
82.33
jan 1, 2011
At the date of observation
Value
Absolute change
Change from the previous value
jan 1, 2003
51.572
+51.572
0.0%
jan 1, 2004
57.842
+6.27
12.16%
jan 1, 2005
56.005
-1.837
-3.18%
jan 1, 2006
42.144
-13.861
-24.75%
jan 1, 2007
51.156
+9.013
21.39%
jan 1, 2008
45.124
-6.033
-11.79%
jan 1, 2009
30.0
-15.124
-33.52%
jan 1, 2010
60.262
+30.262
100.87%
jan 1, 2011
82.33
+22.068
36.62%
Ranking of countries by current statistics by years
About & Feedback
Terms
Privacy
FAQ
Support 24/7
Cabinet
Get premium
Donate
The service accepts bank transfer (ACH, Wire) or cards (Visa, MasterCard, etc). Processed by Stripe.
Secured with SSL