Download This statistics in other country:
Timeline:
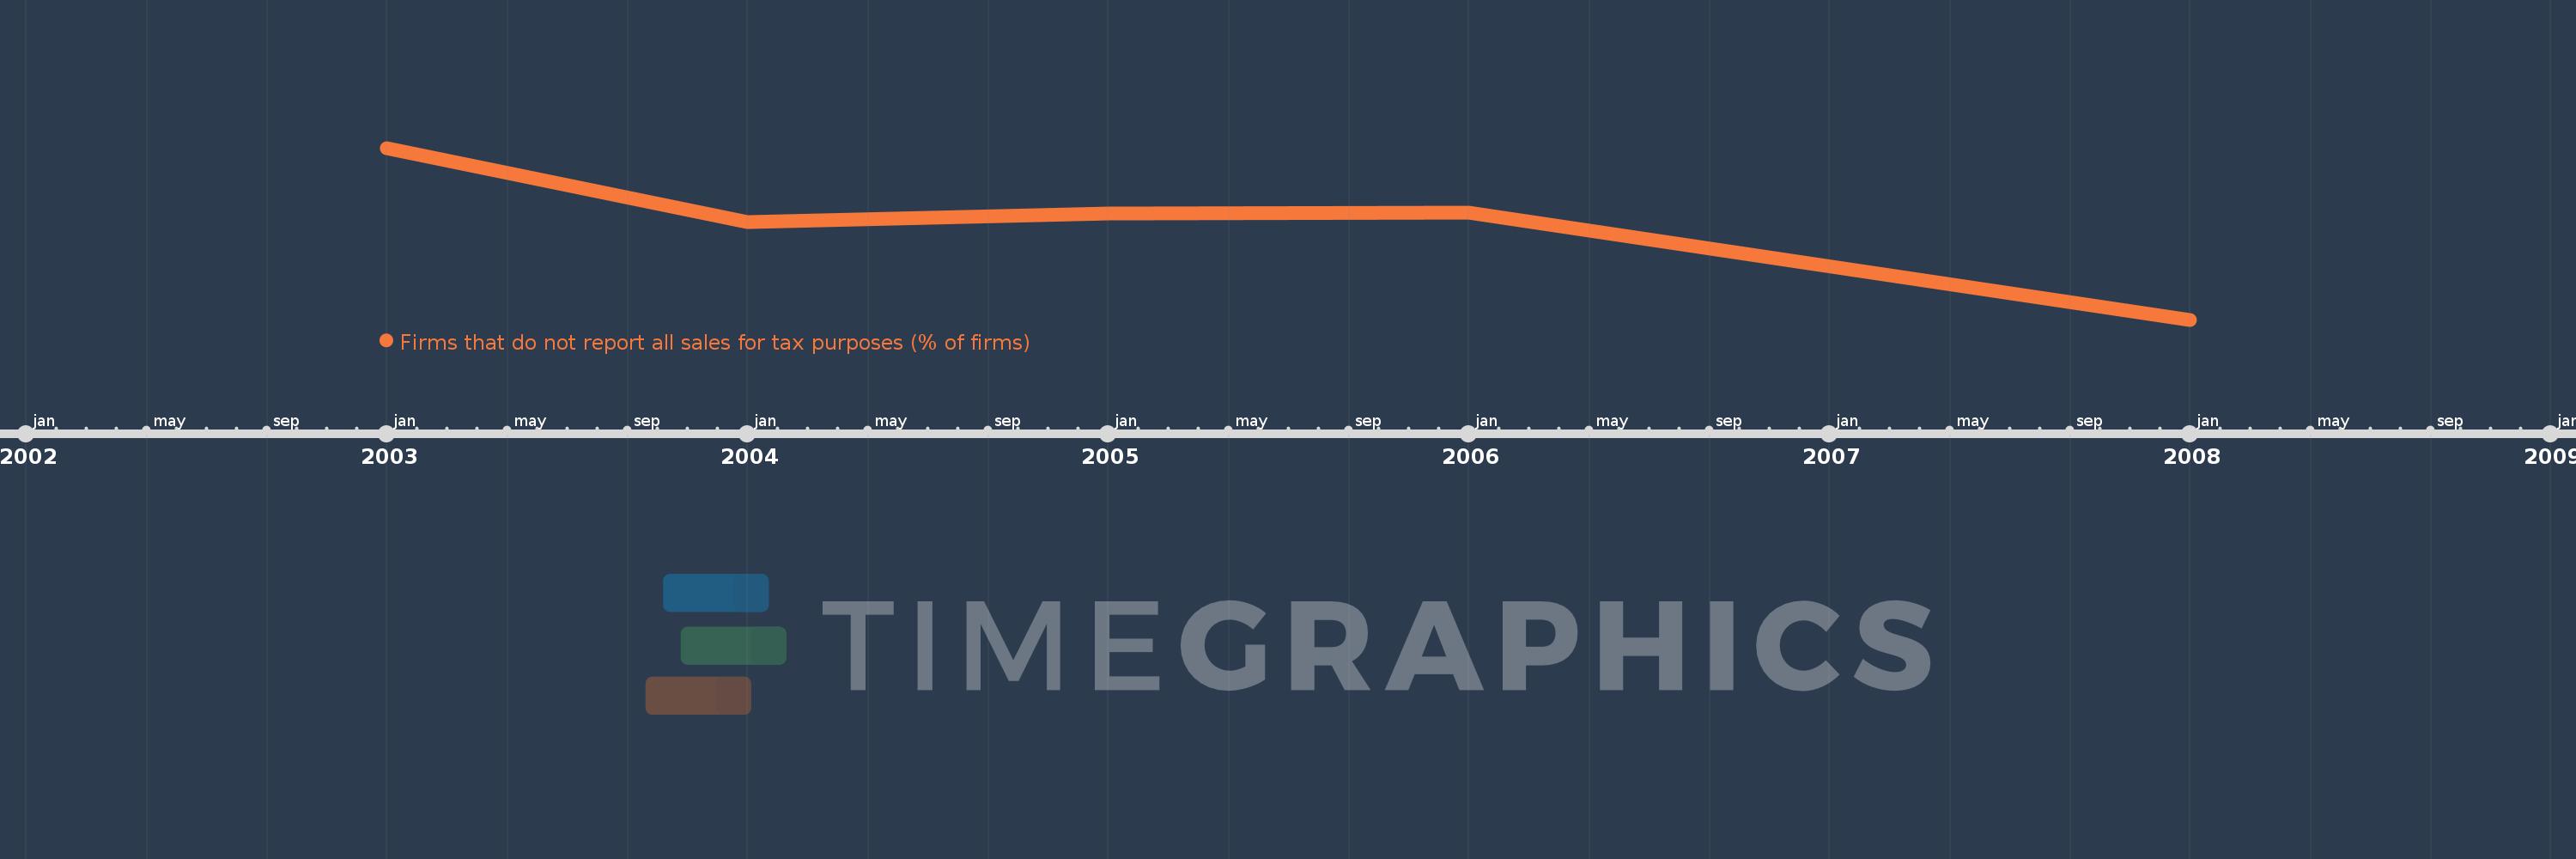
This timeline shows a graph from 2003 to 2008 of European Union. No data until 2002. Number of actual observations by date: 5.
Source name:
World Development Indicators
Source organization:
World Bank, Enterprise Surveys (http://www.enterprisesurveys.org/).
Categories, topics:
Private Sector
Last updated:
apr 23, 2017
Indicators value changes by year
Maximum:
46.655
jan 1, 2003
At the date of observation
Value
Absolute change
Change from the previous value
jan 1, 2003
46.655
+46.655
0.0%
jan 1, 2004
33.66
-12.995
-27.85%
jan 1, 2005
35.11
+1.45
4.31%
jan 1, 2006
35.318
+0.208
0.59%
jan 1, 2008
16.38
-18.938
-53.62%
Ranking of countries by current statistics by years