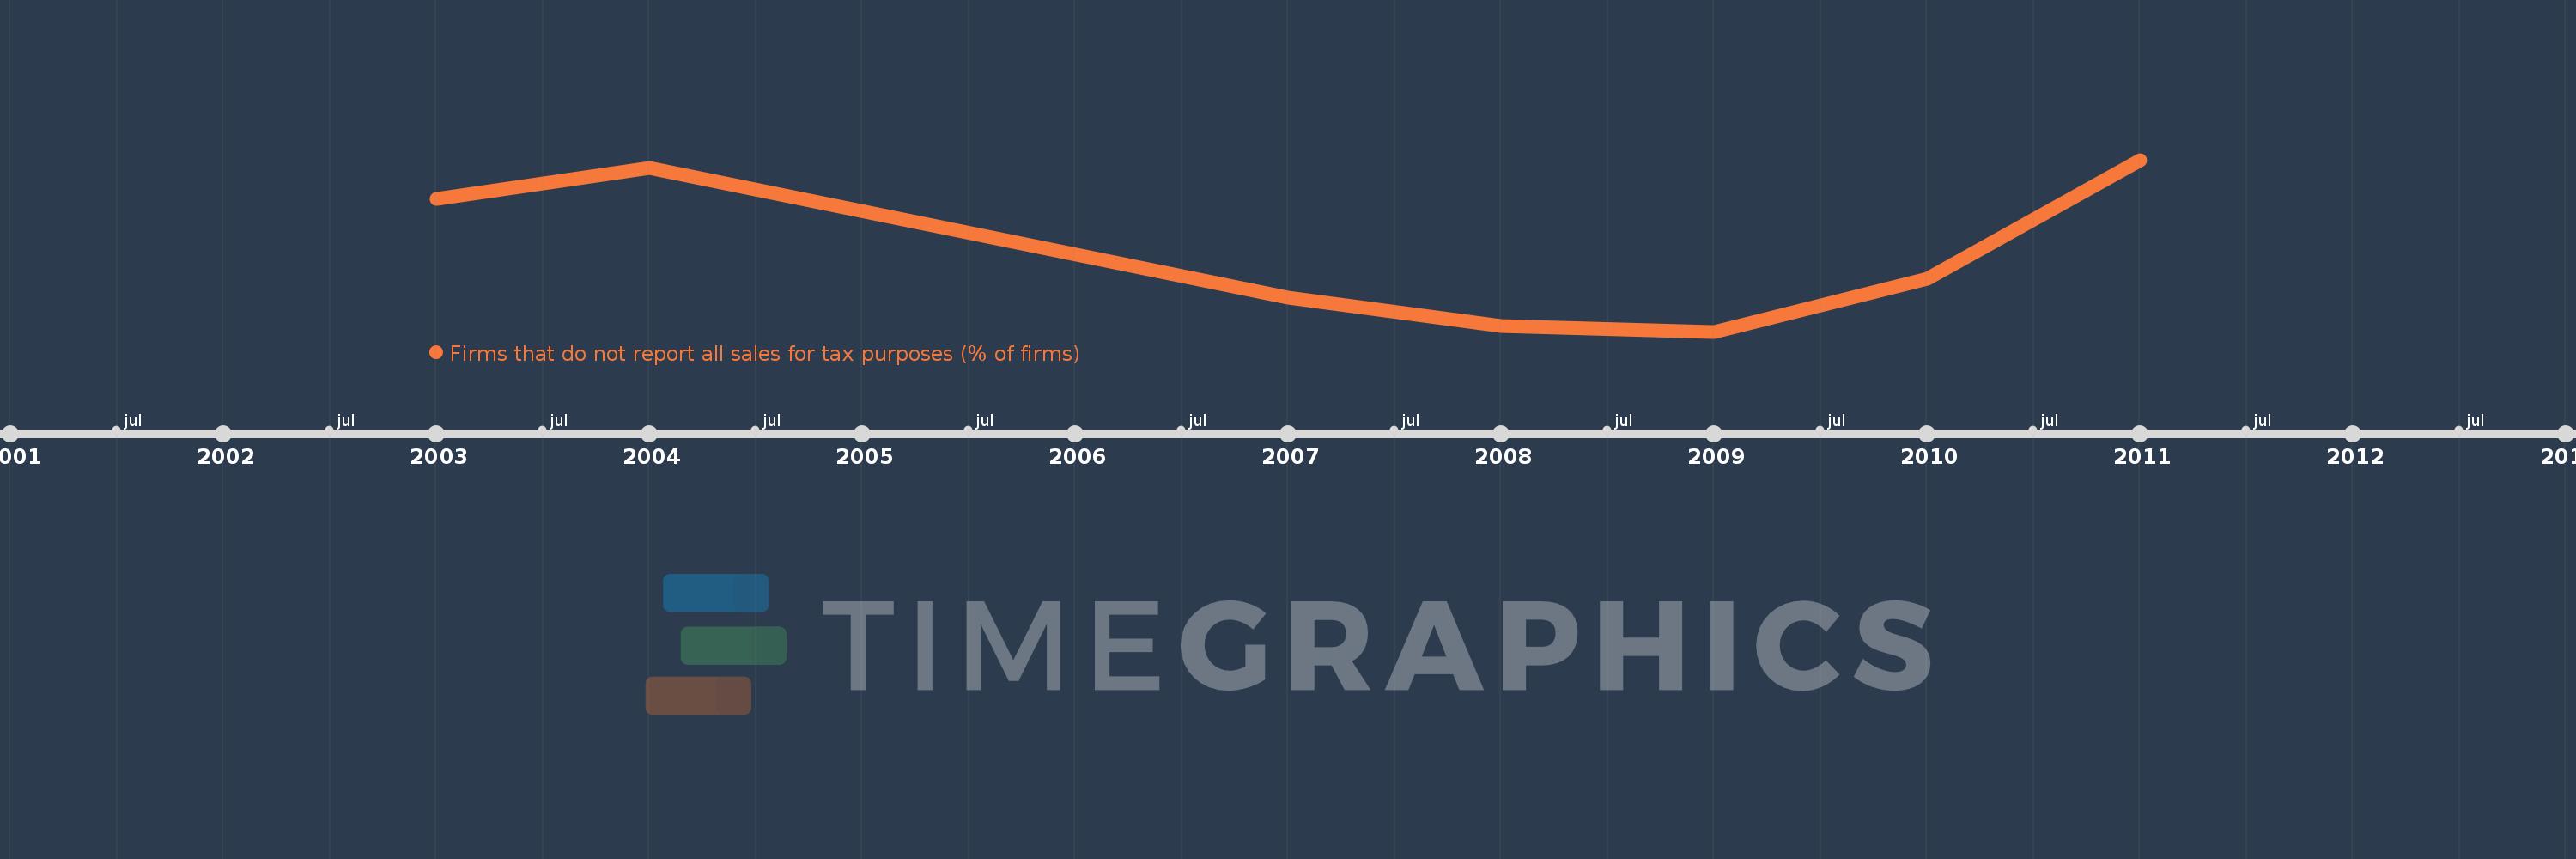
This timeline shows a graph from 2003 to 2011 of Middle East & North Africa (IDA & IBRD countries). No data until 2002. Number of actual observations by date: 7.
Source name:
World Development Indicators
Source organization:
World Bank, Enterprise Surveys (http://www.enterprisesurveys.org/).
Categories, topics:
Private Sector
Last updated:
apr 23, 2017
Indicators value changes by year
Meaning:
54.374
Minimum:
30.0
jan 1, 2009
Maximum:
82.33
jan 1, 2011
At the date of observation
Value
Absolute change
Change from the previous value
jan 1, 2003
70.37
+70.37
0.0%
jan 1, 2004
79.87
+9.5
13.5%
jan 1, 2007
40.21
-39.66
-49.66%
jan 1, 2008
31.82
-8.39
-20.87%
jan 1, 2009
30.0
-1.82
-5.72%
jan 1, 2010
46.02
+16.02
53.4%
jan 1, 2011
82.33
+36.31
78.9%
Ranking of countries by current statistics by years