Download This statistics in other country:
Timeline:
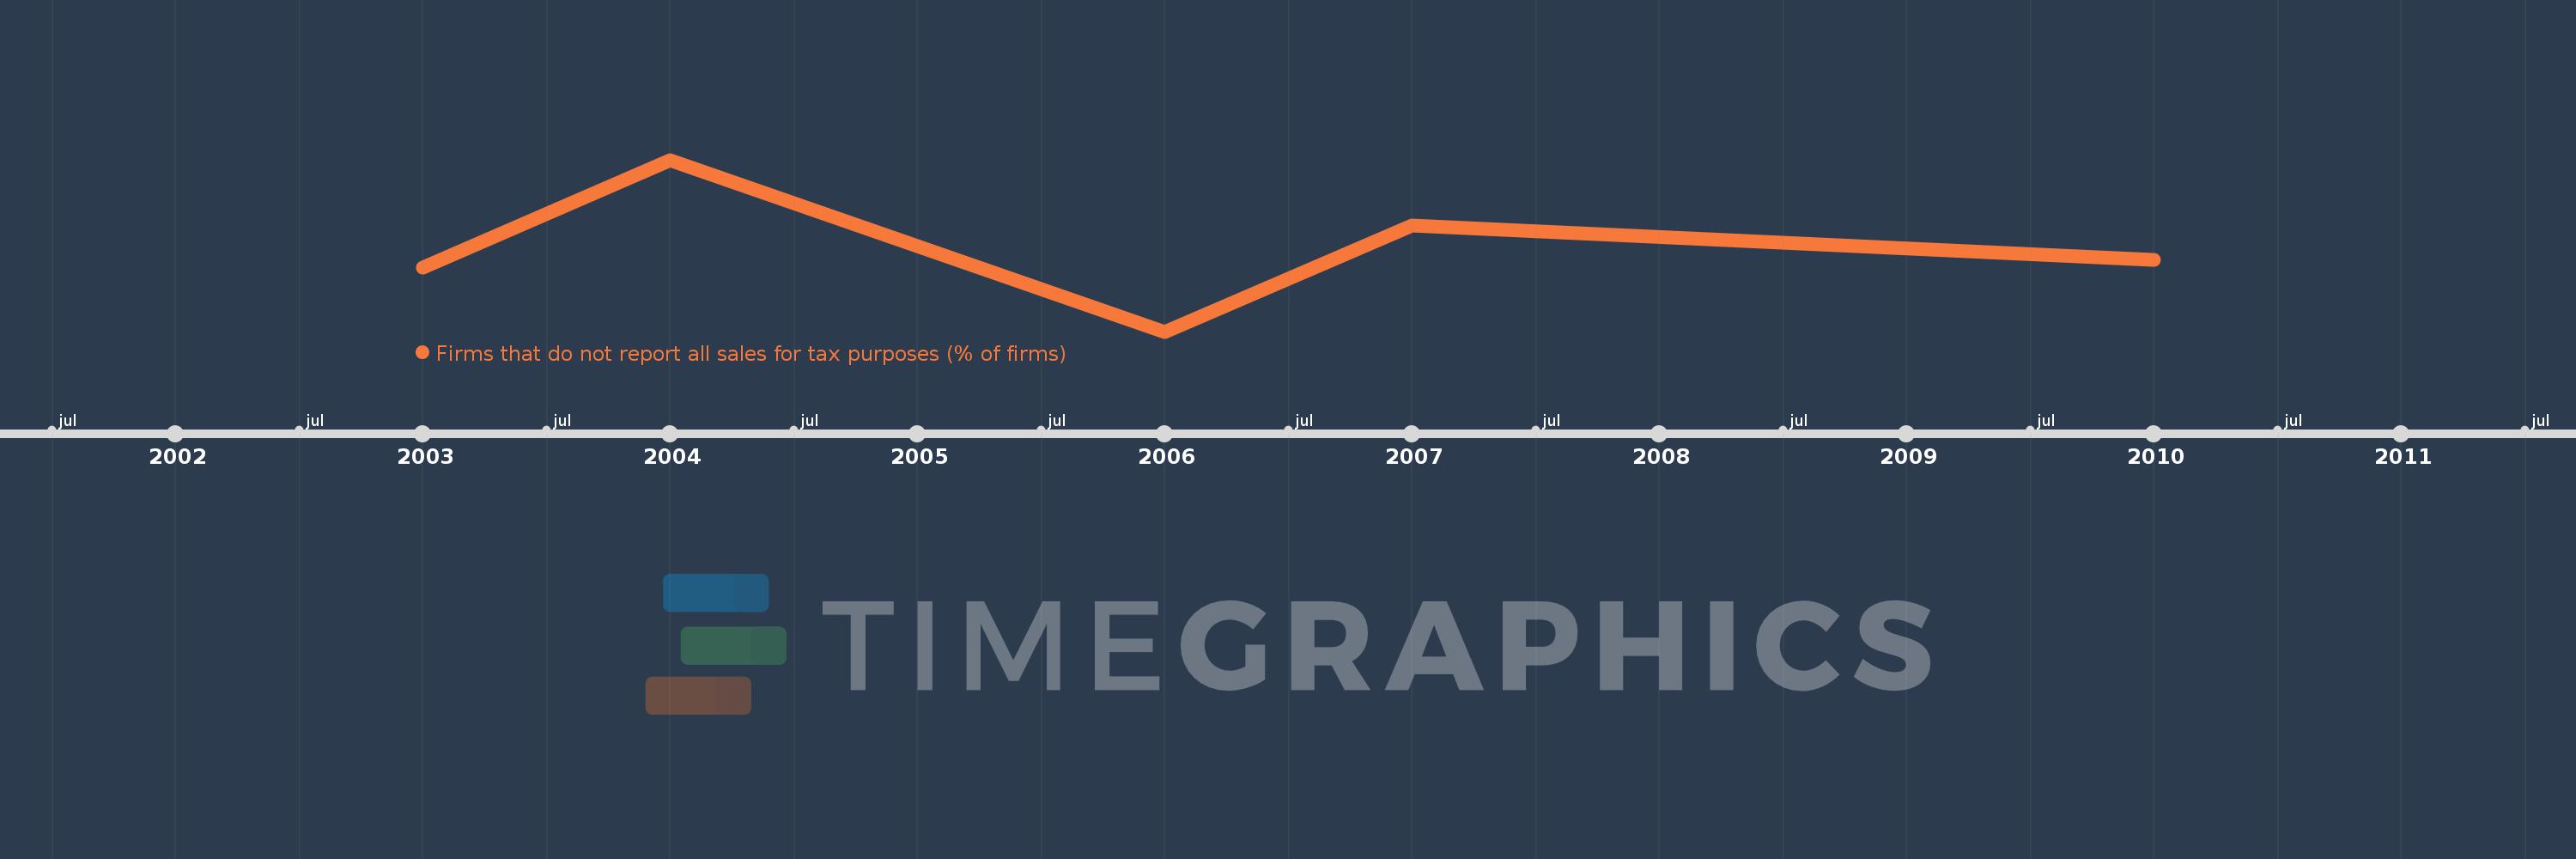
This timeline shows a graph from 2003 to 2010 of Other small states. No data until 2002. Number of actual observations by date: 5.
Source name:
World Development Indicators
Source organization:
World Bank, Enterprise Surveys (http://www.enterprisesurveys.org/).
Categories, topics:
Private Sector
Last updated:
apr 23, 2017
Indicators value changes by year
At the date of observation
Value
Absolute change
Change from the previous value
jan 1, 2003
48.31
+48.31
0.0%
jan 1, 2004
79.17
+30.86
63.88%
jan 1, 2006
29.82
-49.35
-62.33%
jan 1, 2007
60.187
+30.367
101.83%
jan 1, 2010
50.54
-9.647
-16.03%
Ranking of countries by current statistics by years