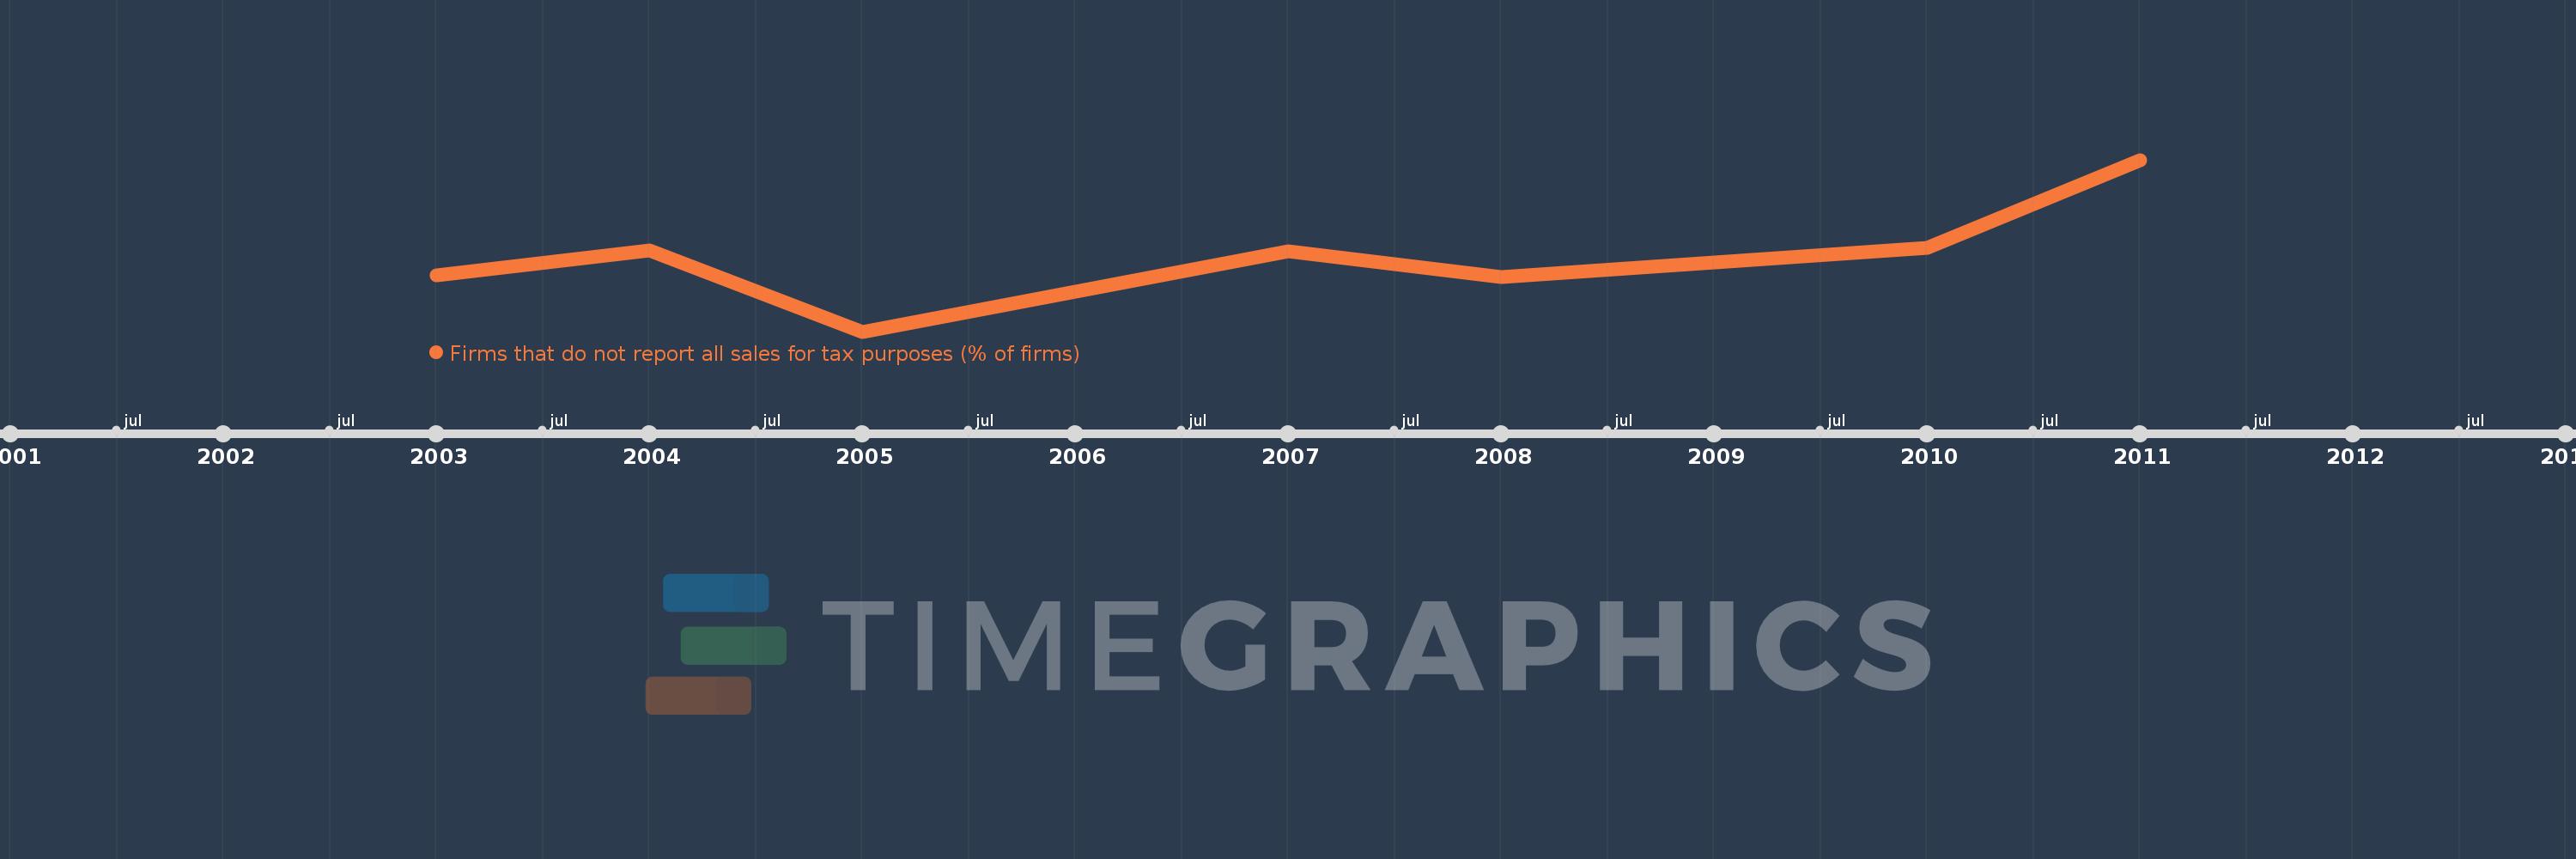
This timeline shows a graph from 2003 to 2011 of Least developed countries: UN classification. No data until 2002. Number of actual observations by date: 7.
Source name:
World Development Indicators
Source organization:
World Bank, Enterprise Surveys (http://www.enterprisesurveys.org/).
Categories, topics:
Private Sector
Last updated:
apr 23, 2017
Indicators value changes by year
Meaning:
58.326
Minimum:
39.55
jan 1, 2005
Maximum:
82.33
jan 1, 2011
At the date of observation
Value
Absolute change
Change from the previous value
jan 1, 2003
53.5
+53.5
0.0%
jan 1, 2004
59.79
+6.29
11.76%
jan 1, 2005
39.55
-20.24
-33.85%
jan 1, 2007
59.651
+20.101
50.83%
jan 1, 2008
53.138
-6.514
-10.92%
jan 1, 2010
60.325
+7.188
13.53%
jan 1, 2011
82.33
+22.005
36.48%
Ranking of countries by current statistics by years