Download This statistics in other country:
Timeline:
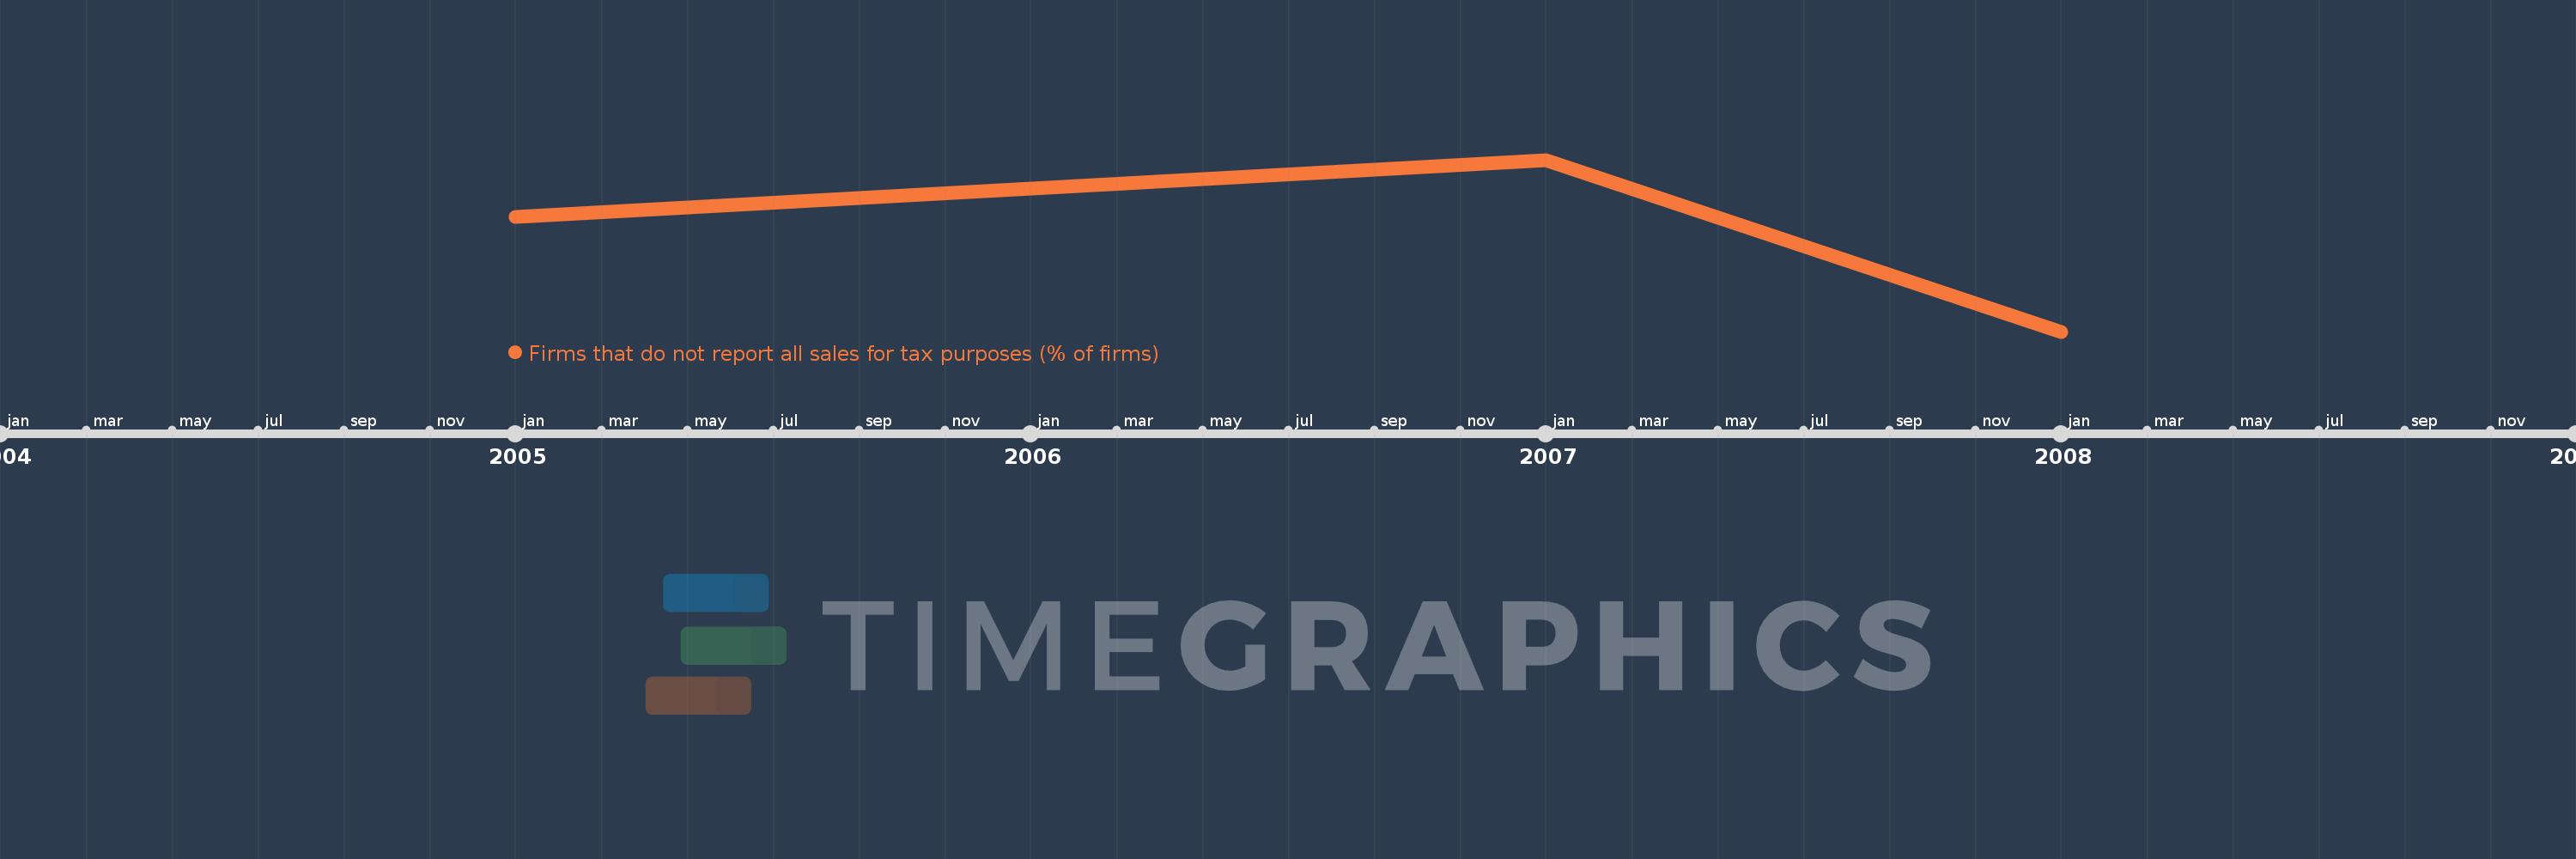
This timeline shows a graph from 2005 to 2008 of South Asia (IDA & IBRD). No data until 2004. Number of actual observations by date: 3.
Source name:
World Development Indicators
Source organization:
World Bank, Enterprise Surveys (http://www.enterprisesurveys.org/).
Categories, topics:
Private Sector
Last updated:
apr 23, 2017
Indicators value changes by year
At the date of observation
Value
Absolute change
Change from the previous value
jan 1, 2005
41.97
+41.97
0.0%
jan 1, 2007
59.24
+17.27
41.15%
jan 1, 2008
7.57
-51.67
-87.22%
Ranking of countries by current statistics by years