Download This statistics in other country:
Timeline:
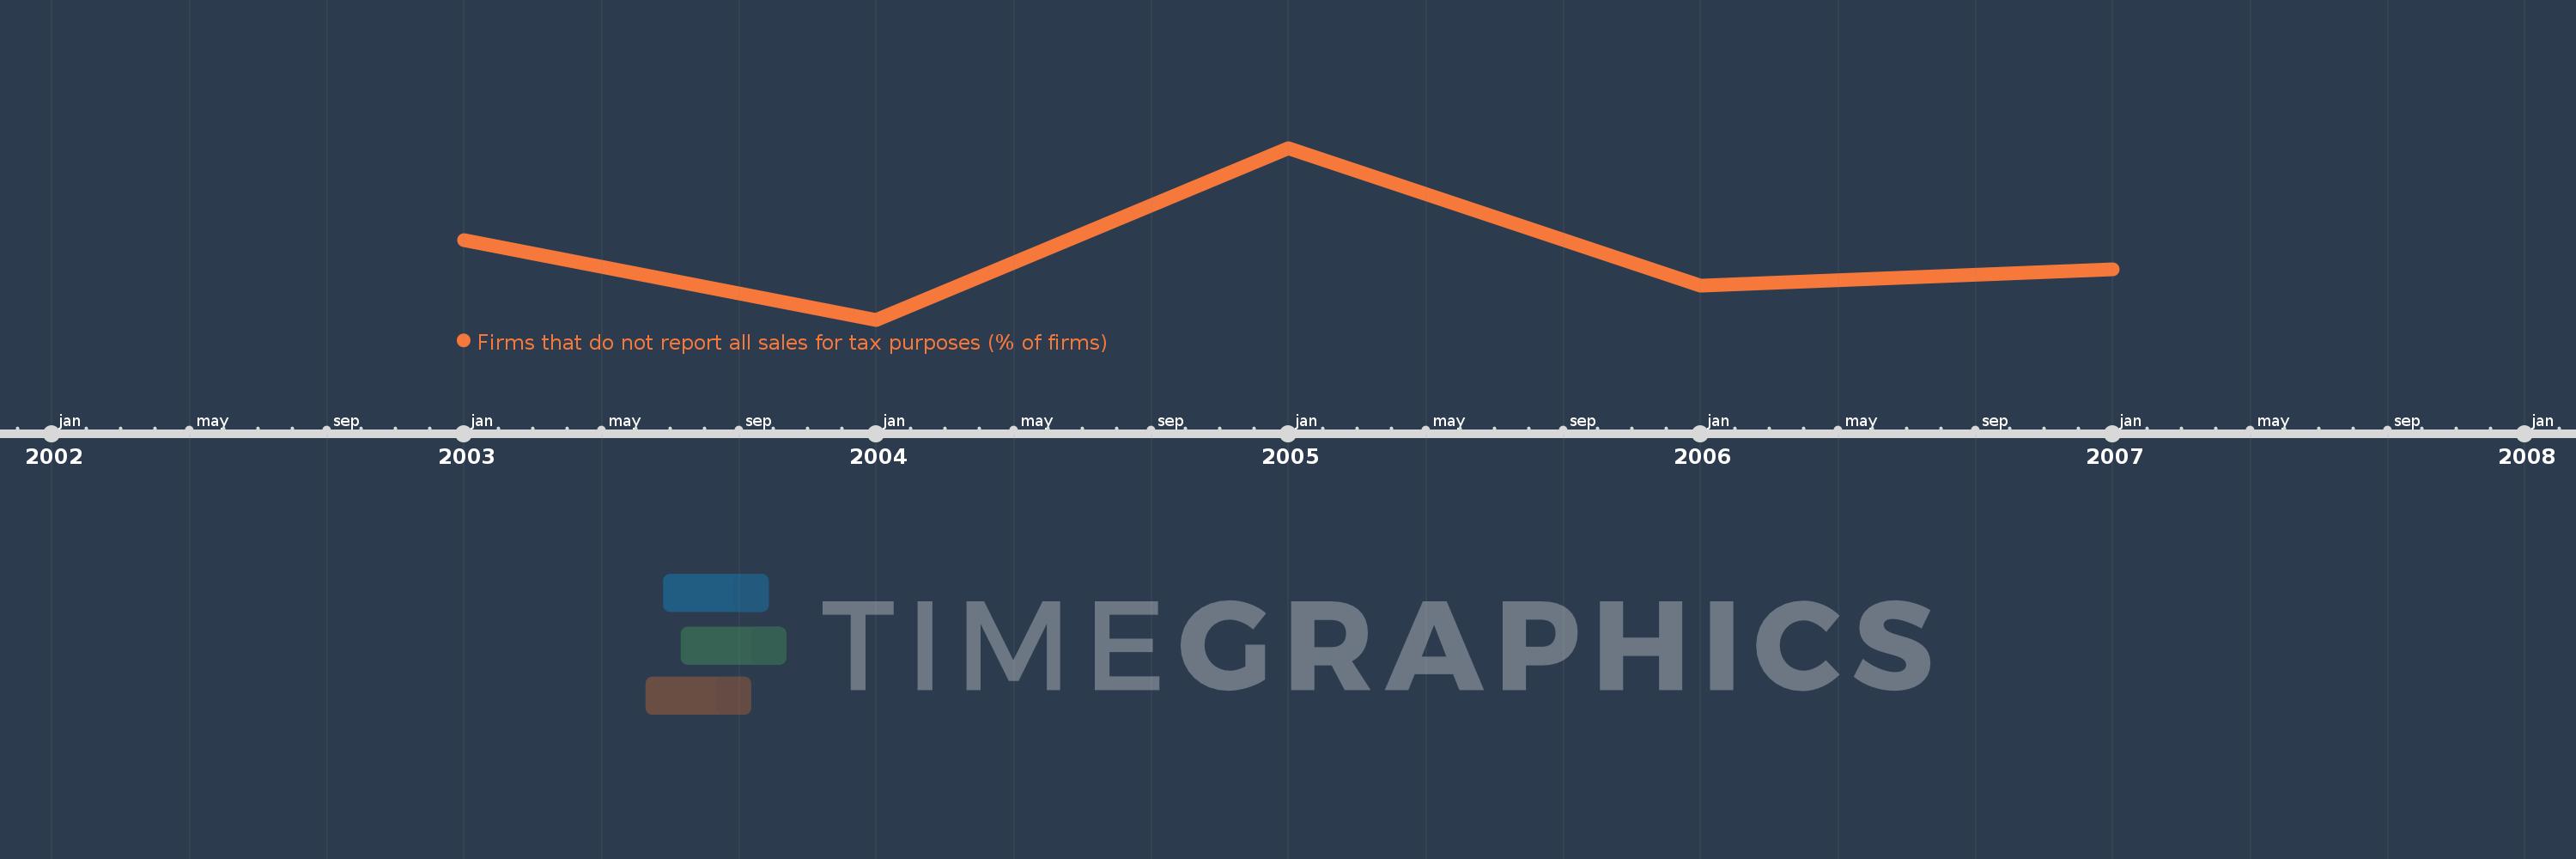
This timeline shows a graph from 2003 to 2007 of OECD members. No data until 2002. Number of actual observations by date: 5.
Source name:
World Development Indicators
Source organization:
World Bank, Enterprise Surveys (http://www.enterprisesurveys.org/).
Categories, topics:
Private Sector
Last updated:
apr 23, 2017
Indicators value changes by year
At the date of observation
Value
Absolute change
Change from the previous value
jan 1, 2003
48.04
+48.04
0.0%
jan 1, 2004
33.66
-14.38
-29.93%
jan 1, 2005
64.64
+30.98
92.04%
jan 1, 2006
39.795
-24.845
-38.44%
jan 1, 2007
42.77
+2.975
7.48%
Ranking of countries by current statistics by years