Download This statistics in other country:
Timeline:
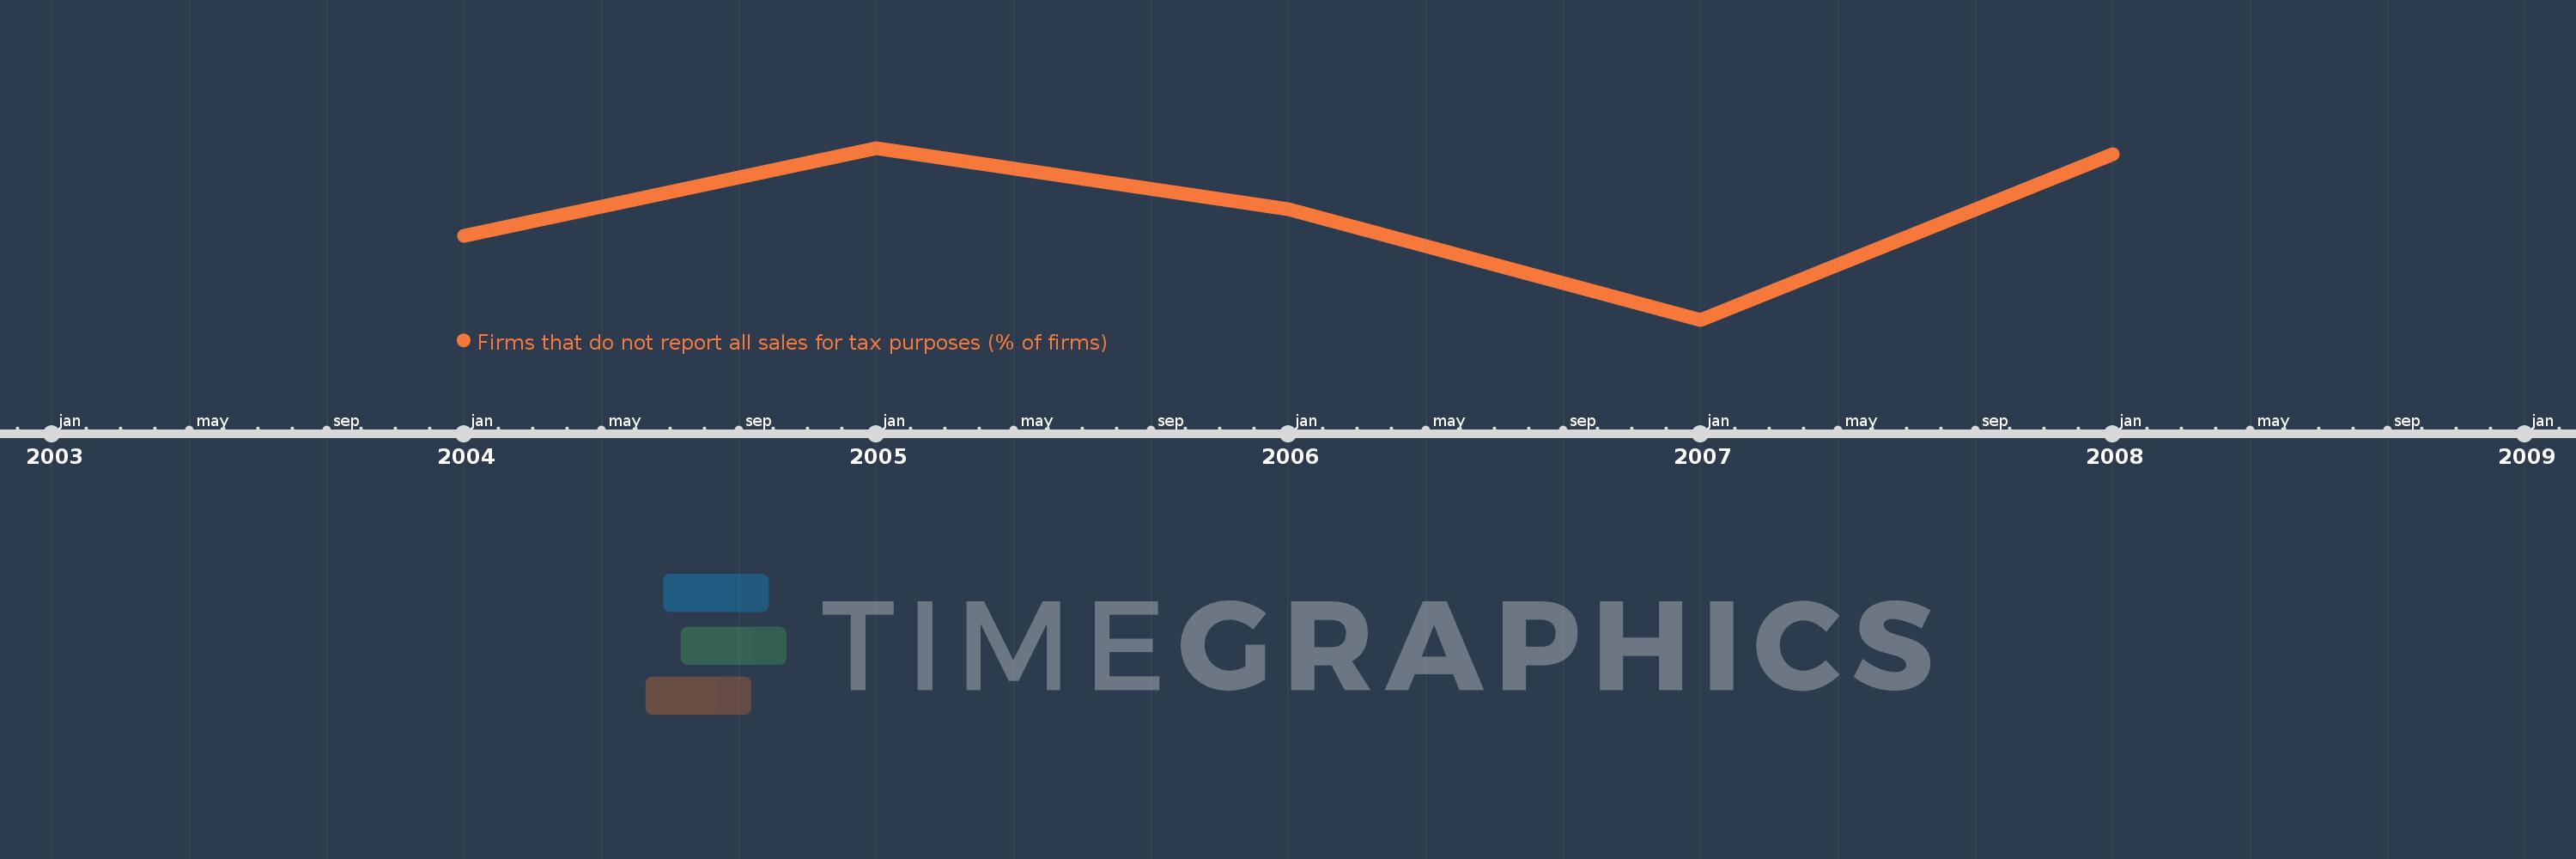
This timeline shows a graph from 2004 to 2008 of East Asia & Pacific. No data until 2003. Number of actual observations by date: 5.
Source name:
World Development Indicators
Source organization:
World Bank, Enterprise Surveys (http://www.enterprisesurveys.org/).
Categories, topics:
Private Sector
Last updated:
apr 23, 2017
Indicators value changes by year
At the date of observation
Value
Absolute change
Change from the previous value
jan 1, 2004
46.745
+46.745
0.0%
jan 1, 2005
80.4
+33.655
72.0%
jan 1, 2006
56.975
-23.425
-29.14%
jan 1, 2007
14.88
-42.095
-73.88%
jan 1, 2008
78.11
+63.23
424.93%
Ranking of countries by current statistics by years