Download This statistics in other country:
Timeline:
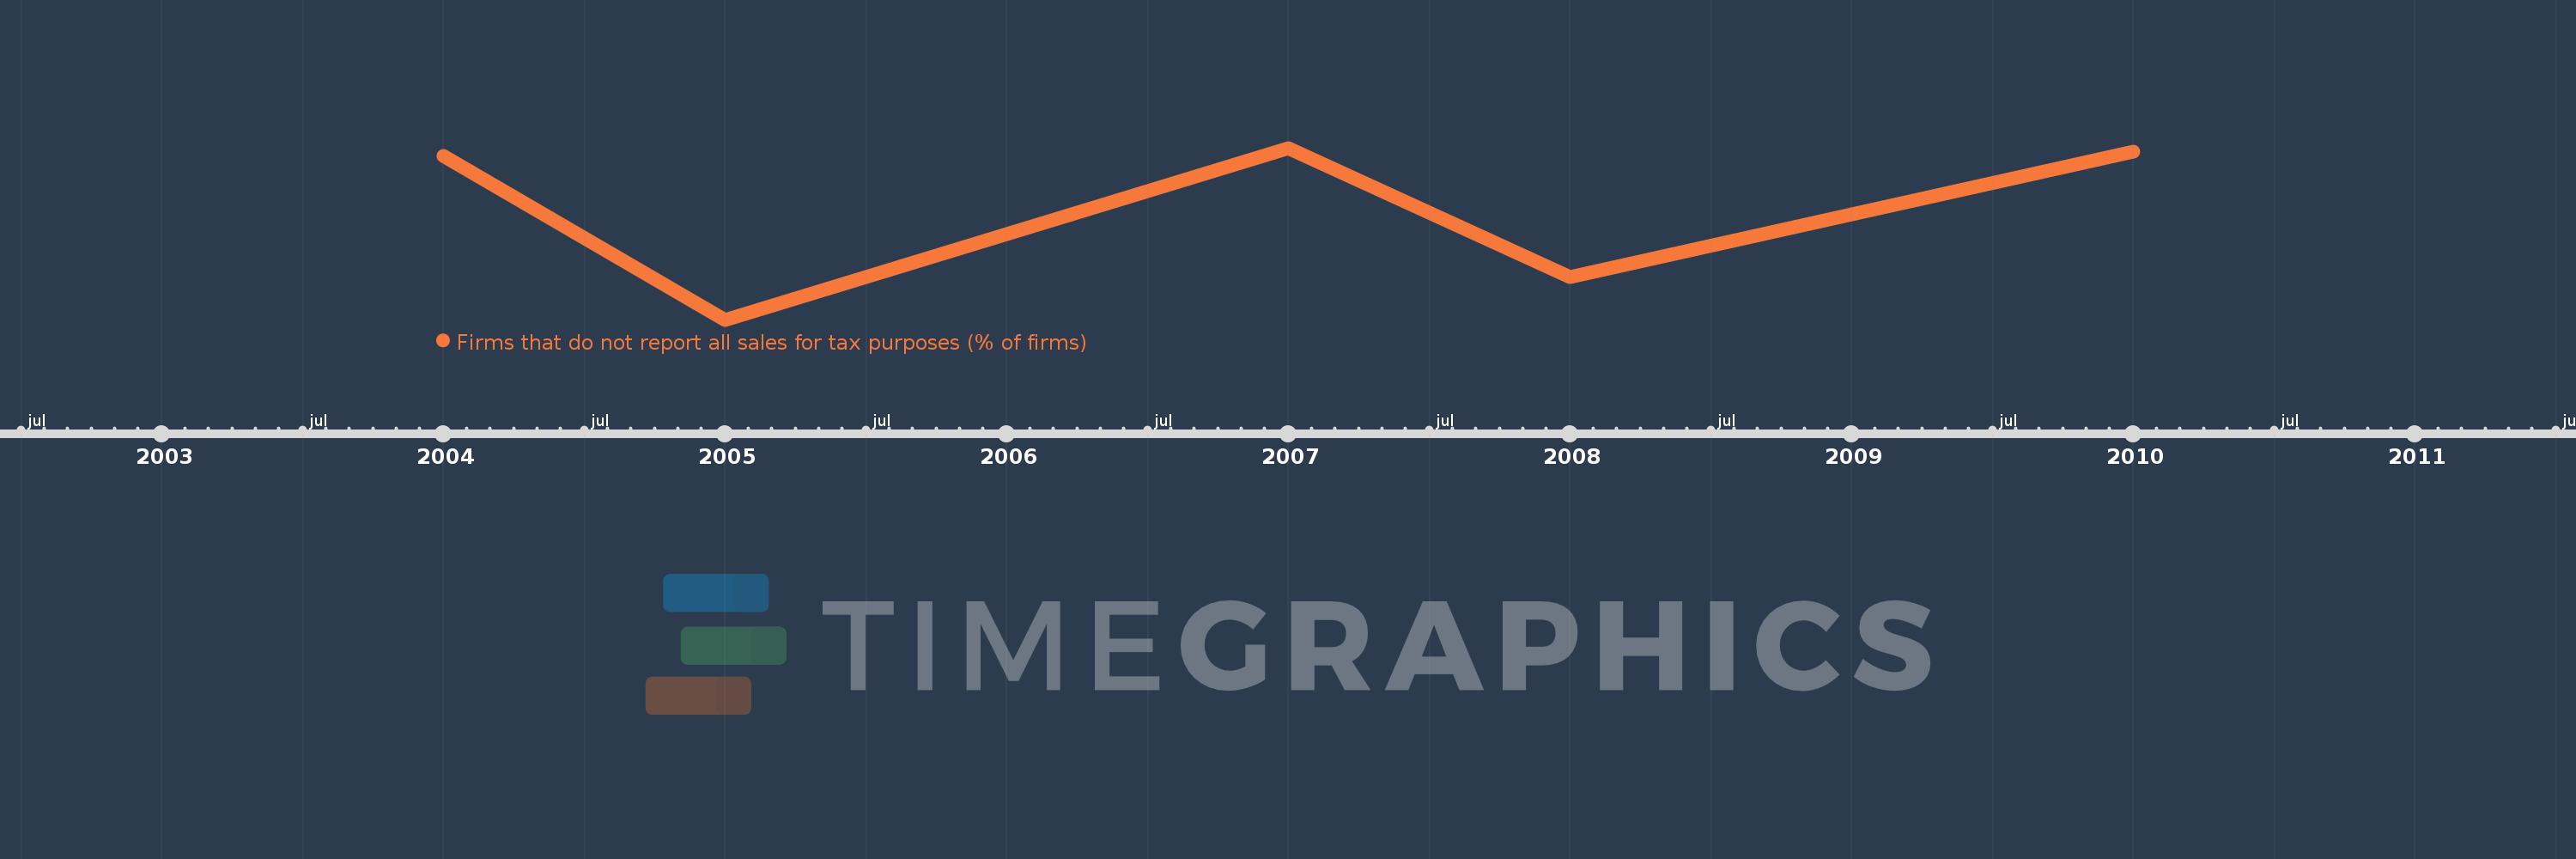
This timeline shows a graph from 2004 to 2010 of Low income. No data until 2003. Number of actual observations by date: 5.
Source name:
World Development Indicators
Source organization:
World Bank, Enterprise Surveys (http://www.enterprisesurveys.org/).
Categories, topics:
Private Sector
Last updated:
apr 23, 2017
Indicators value changes by year
Maximum:
60.799
jan 1, 2007
At the date of observation
Value
Absolute change
Change from the previous value
jan 1, 2004
59.79
+59.79
0.0%
jan 1, 2005
39.55
-20.24
-33.85%
jan 1, 2007
60.799
+21.249
53.73%
jan 1, 2008
44.813
-15.986
-26.29%
jan 1, 2010
60.325
+15.512
34.61%
Ranking of countries by current statistics by years