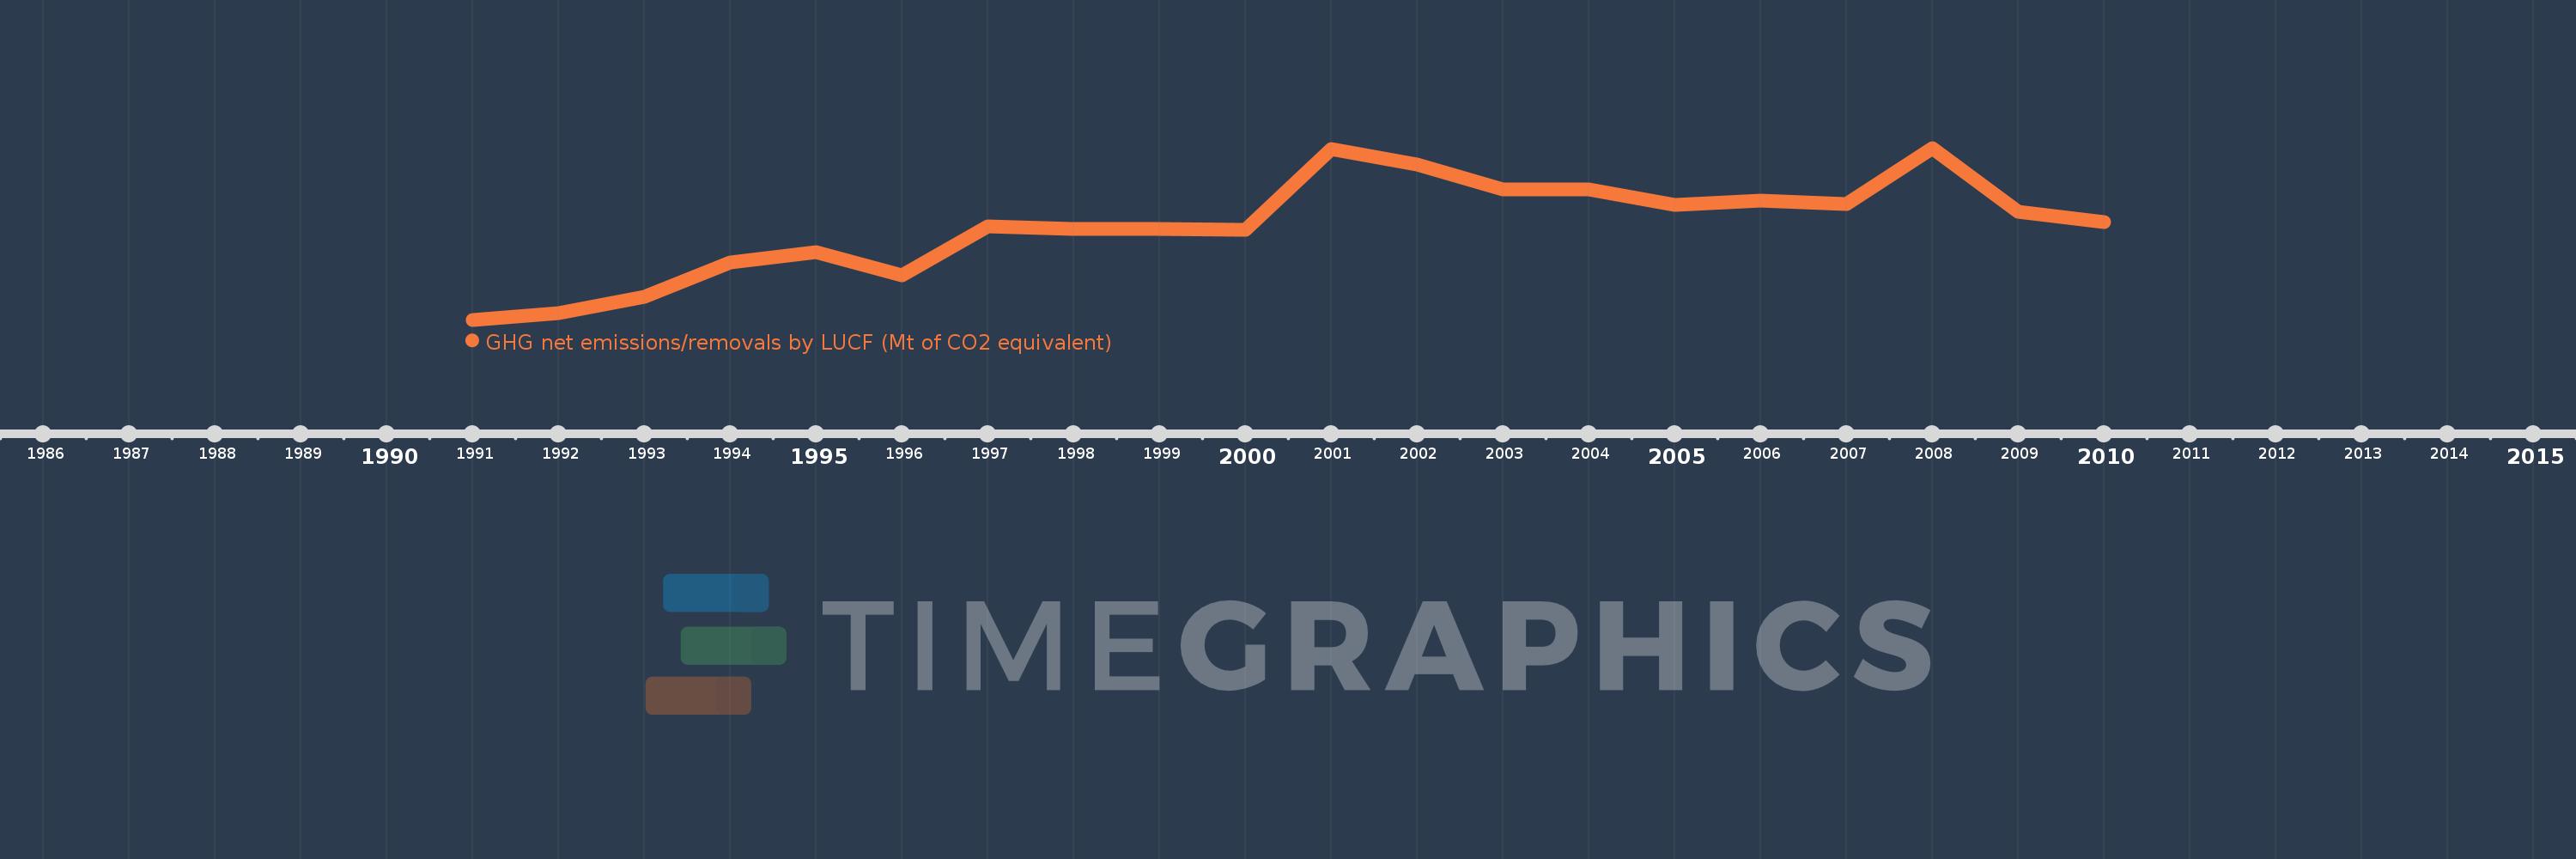
Questa scala temporale mostra un grafico dal 1991 anno al 2010 anno. Bulgaria. I dati fino ad 1990 anno non disponibili. Il numero di osservazioni attuali secondo i date: 20.
La fonte (nome):
Indicatori dello sviluppo mondiale
La fonte (organizzazione):
United Nations Framework Convention on Climate Change.
Categorie:
Climate Change, Environment
sono stati aggiornati
23 apr 2017 anni
Indicatori delle variazioni dei valori per anni
In media:
-11.865
Minima:
-13.806
1 gen 1991 anni
Massimo:
-10.255
1 gen 2008 anni
Alla data di osservazione
Valore
Variazione assoluta
La variazione rispetto al valore precedente
1 gen 1991 anni
-13.806
-13.806
0.0%
1 gen 1992 anni
-13.672
+0.134
-0.97%
1 gen 1993 anni
-13.339
+0.333
-2.44%
1 gen 1994 anni
-12.621
+0.717
-5.38%
1 gen 1995 anni
-12.4
+0.221
-1.75%
1 gen 1996 anni
-12.886
-0.485
3.91%
1 gen 1997 anni
-11.871
+1.015
-7.87%
1 gen 1998 anni
-11.937
-0.066
0.55%
1 gen 1999 anni
-11.931
+0.005
-0.05%
1 gen 2000 anni
-11.944
-0.013
0.11%
1 gen 2001 anni
-10.276
+1.668
-13.96%
1 gen 2002 anni
-10.605
-0.329
3.2%
1 gen 2003 anni
-11.109
-0.504
4.75%
1 gen 2004 anni
-11.121
-0.012
0.11%
1 gen 2005 anni
-11.441
-0.32
2.88%
1 gen 2006 anni
-11.336
+0.105
-0.92%
1 gen 2007 anni
-11.406
-0.069
0.61%
1 gen 2008 anni
-10.255
+1.151
-10.09%
1 gen 2009 anni
-11.566
-1.311
12.79%
1 gen 2010 anni
-11.782
-0.216
1.87%
Classificazione dei paesi secondo i statistiche attuali per anni