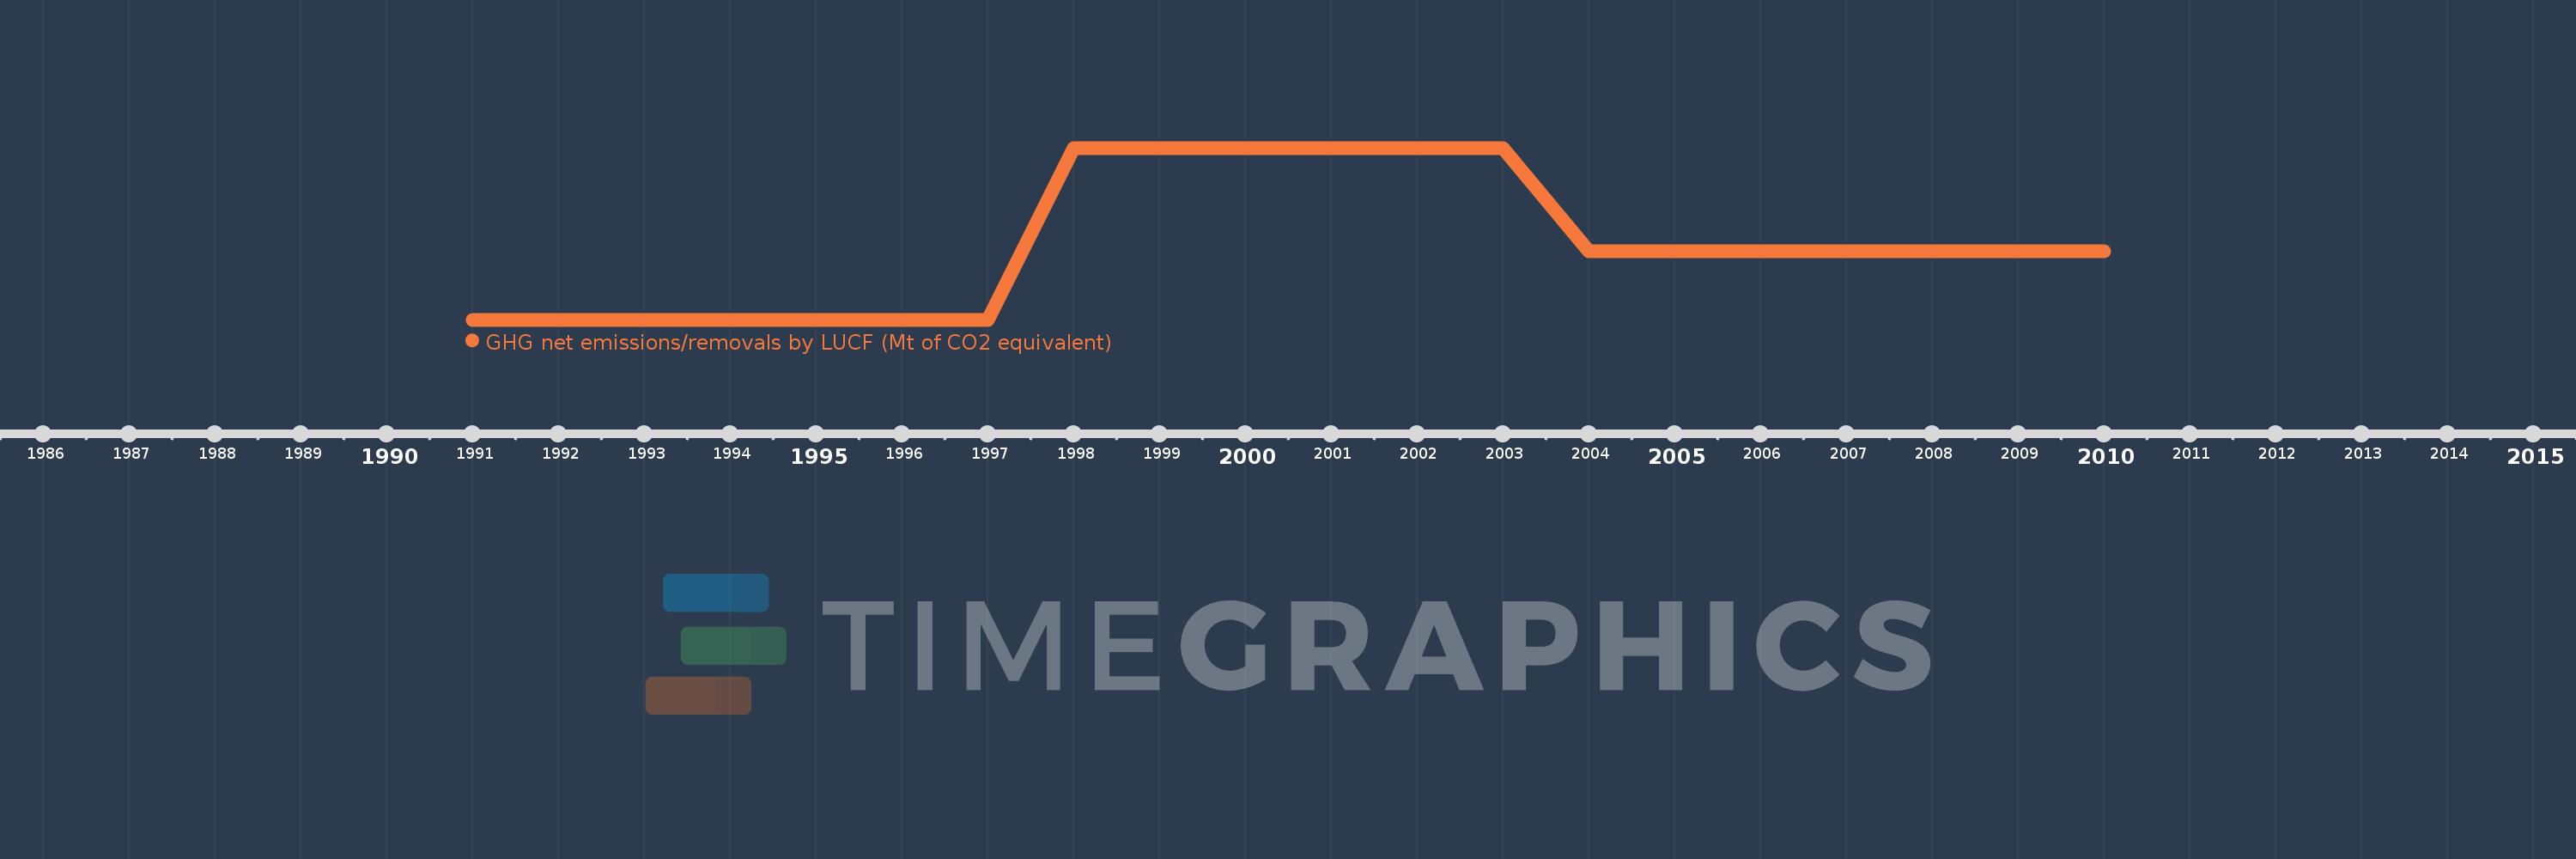
Questa scala temporale mostra un grafico dal 1991 anno al 2010 anno. Liechtenstein. I dati fino ad 1990 anno non disponibili. Il numero di osservazioni attuali secondo i date: 20.
La fonte (nome):
Indicatori dello sviluppo mondiale
La fonte (organizzazione):
United Nations Framework Convention on Climate Change.
Categorie:
Climate Change, Environment
sono stati aggiornati
23 apr 2017 anni
Indicatori delle variazioni dei valori per anni
In media:
-0.006
Minima:
-0.008
1 gen 1997 anni
Massimo:
-0.003
1 gen 2000 anni
Alla data di osservazione
Valore
Variazione assoluta
La variazione rispetto al valore precedente
1 gen 1991 anni
-0.008
-0.008
0.0%
1 gen 1992 anni
-0.008
0.0
0.43%
1 gen 1993 anni
-0.008
0.0
0.43%
1 gen 1994 anni
-0.008
0.0
0.43%
1 gen 1995 anni
-0.008
0.0
0.42%
1 gen 1996 anni
-0.008
0.0
0.03%
1 gen 1997 anni
-0.008
0.0
0.41%
1 gen 1998 anni
-0.003
+0.005
-59.79%
1 gen 1999 anni
-0.003
+0.0
-0.28%
1 gen 2000 anni
-0.003
+0.0
-3.74%
1 gen 2001 anni
-0.003
0.0
0.2%
1 gen 2002 anni
-0.003
0.0
5.48%
1 gen 2003 anni
-0.003
+0.0
-1.58%
1 gen 2004 anni
-0.006
-0.003
78.02%
1 gen 2005 anni
-0.006
0.0
0.45%
1 gen 2006 anni
-0.006
0.0
0.35%
1 gen 2007 anni
-0.006
0.0
0.47%
1 gen 2008 anni
-0.006
0.0
0.34%
1 gen 2009 anni
-0.006
0.0
0.37%
1 gen 2010 anni
-0.006
0.0
0.39%
Classificazione dei paesi secondo i statistiche attuali per anni