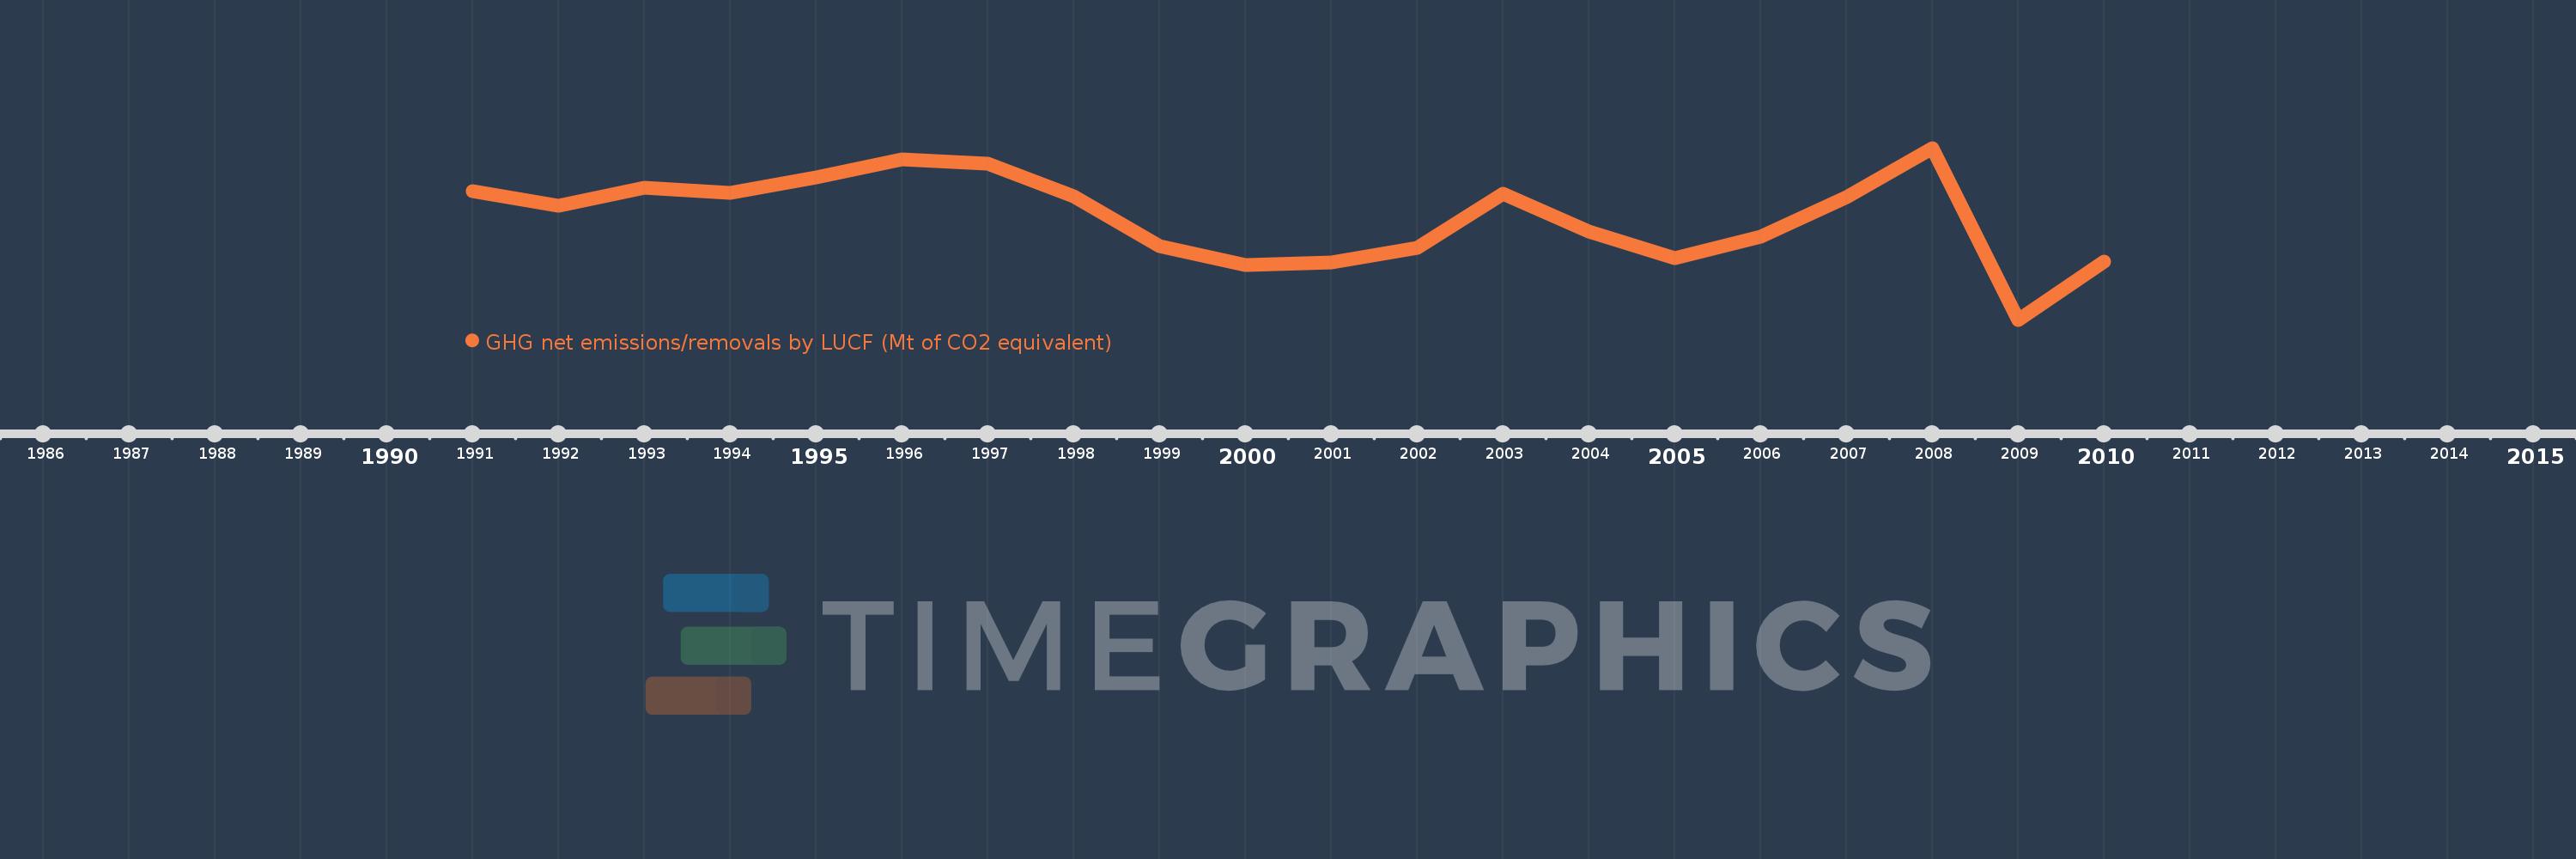
Questa scala temporale mostra un grafico dal 1991 anno al 2010 anno. New Zealand. I dati fino ad 1990 anno non disponibili. Il numero di osservazioni attuali secondo i date: 20.
La fonte (nome):
Indicatori dello sviluppo mondiale
La fonte (organizzazione):
United Nations Framework Convention on Climate Change.
Categorie:
Climate Change, Environment
sono stati aggiornati
23 apr 2017 anni
Indicatori delle variazioni dei valori per anni
In media:
-24.637
Minima:
-29.36
1 gen 2009 anni
Massimo:
-21.46
1 gen 2008 anni
Alla data di osservazione
Valore
Variazione assoluta
La variazione rispetto al valore precedente
1 gen 1991 anni
-23.451
-23.451
0.0%
1 gen 1992 anni
-24.116
-0.665
2.84%
1 gen 1993 anni
-23.288
+0.829
-3.44%
1 gen 1994 anni
-23.518
-0.23
0.99%
1 gen 1995 anni
-22.817
+0.701
-2.98%
1 gen 1996 anni
-21.967
+0.85
-3.72%
1 gen 1997 anni
-22.174
-0.207
0.94%
1 gen 1998 anni
-23.674
-1.5
6.76%
1 gen 1999 anni
-25.956
-2.282
9.64%
1 gen 2000 anni
-26.859
-0.902
3.48%
1 gen 2001 anni
-26.715
+0.144
-0.53%
1 gen 2002 anni
-26.048
+0.667
-2.5%
1 gen 2003 anni
-23.58
+2.468
-9.48%
1 gen 2004 anni
-25.289
-1.71
7.25%
1 gen 2005 anni
-26.512
-1.222
4.83%
1 gen 2006 anni
-25.543
+0.969
-3.65%
1 gen 2007 anni
-23.728
+1.815
-7.1%
1 gen 2008 anni
-21.46
+2.268
-9.56%
1 gen 2009 anni
-29.36
-7.9
36.81%
1 gen 2010 anni
-26.683
+2.677
-9.12%
Classificazione dei paesi secondo i statistiche attuali per anni