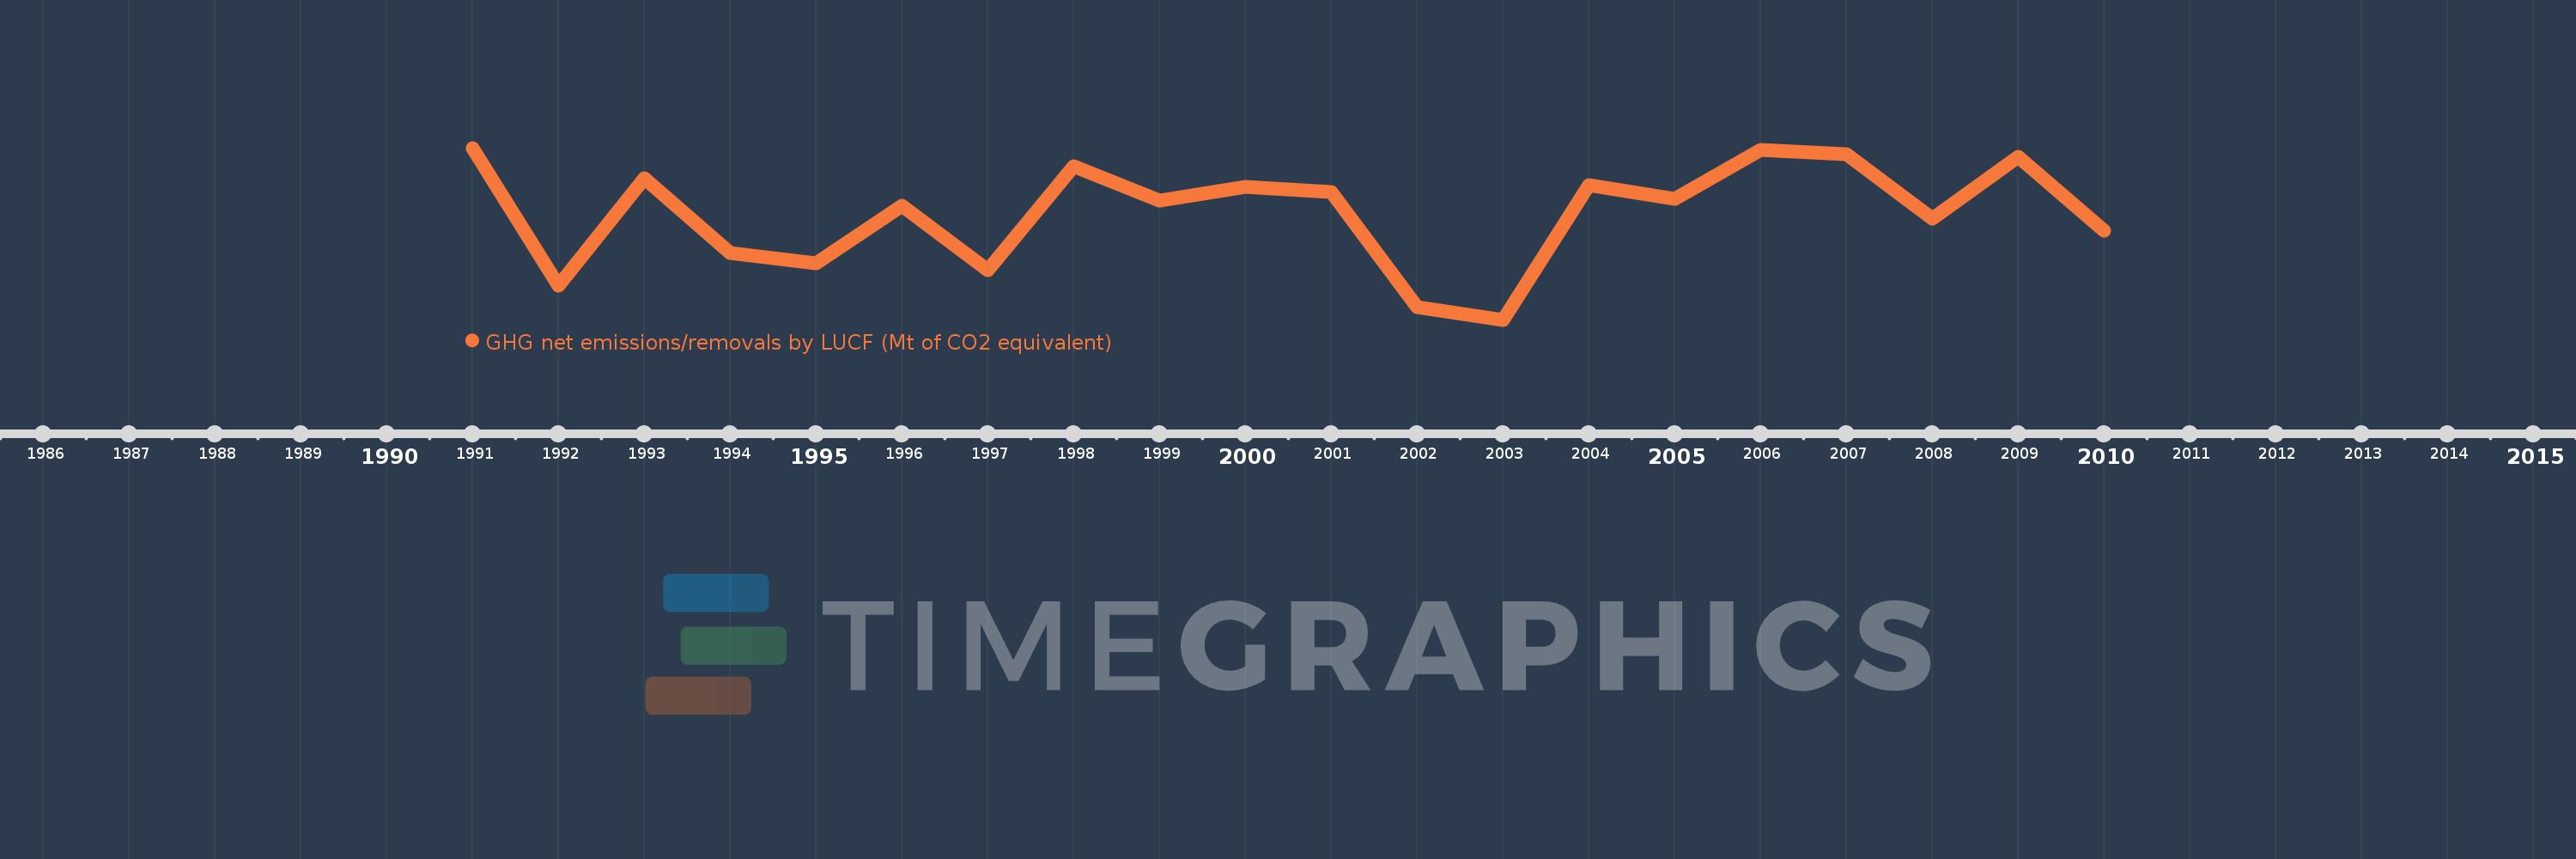
Questa scala temporale mostra un grafico dal 1991 anno al 2010 anno. Netherlands. I dati fino ad 1990 anno non disponibili. Il numero di osservazioni attuali secondo i date: 20.
La fonte (nome):
Indicatori dello sviluppo mondiale
La fonte (organizzazione):
United Nations Framework Convention on Climate Change.
Categorie:
Climate Change, Environment
sono stati aggiornati
23 apr 2017 anni
Indicatori delle variazioni dei valori per anni
In media:
2.52
Minima:
2.242
1 gen 2003 anni
Massimo:
2.692
1 gen 1991 anni
Alla data di osservazione
Valore
Variazione assoluta
La variazione rispetto al valore precedente
1 gen 1991 anni
2.692
+2.692
0.0%
1 gen 1992 anni
2.332
-0.36
-13.37%
1 gen 1993 anni
2.613
+0.281
12.03%
1 gen 1994 anni
2.416
-0.196
-7.51%
1 gen 1995 anni
2.389
-0.028
-1.15%
1 gen 1996 anni
2.54
+0.151
6.32%
1 gen 1997 anni
2.371
-0.168
-6.62%
1 gen 1998 anni
2.645
+0.273
11.53%
1 gen 1999 anni
2.553
-0.092
-3.48%
1 gen 2000 anni
2.589
+0.036
1.43%
1 gen 2001 anni
2.576
-0.013
-0.52%
1 gen 2002 anni
2.274
-0.302
-11.73%
1 gen 2003 anni
2.242
-0.032
-1.41%
1 gen 2004 anni
2.594
+0.353
15.73%
1 gen 2005 anni
2.558
-0.037
-1.41%
1 gen 2006 anni
2.687
+0.13
5.07%
1 gen 2007 anni
2.675
-0.012
-0.45%
1 gen 2008 anni
2.507
-0.169
-6.31%
1 gen 2009 anni
2.668
+0.161
6.44%
1 gen 2010 anni
2.475
-0.193
-7.23%
Classificazione dei paesi secondo i statistiche attuali per anni