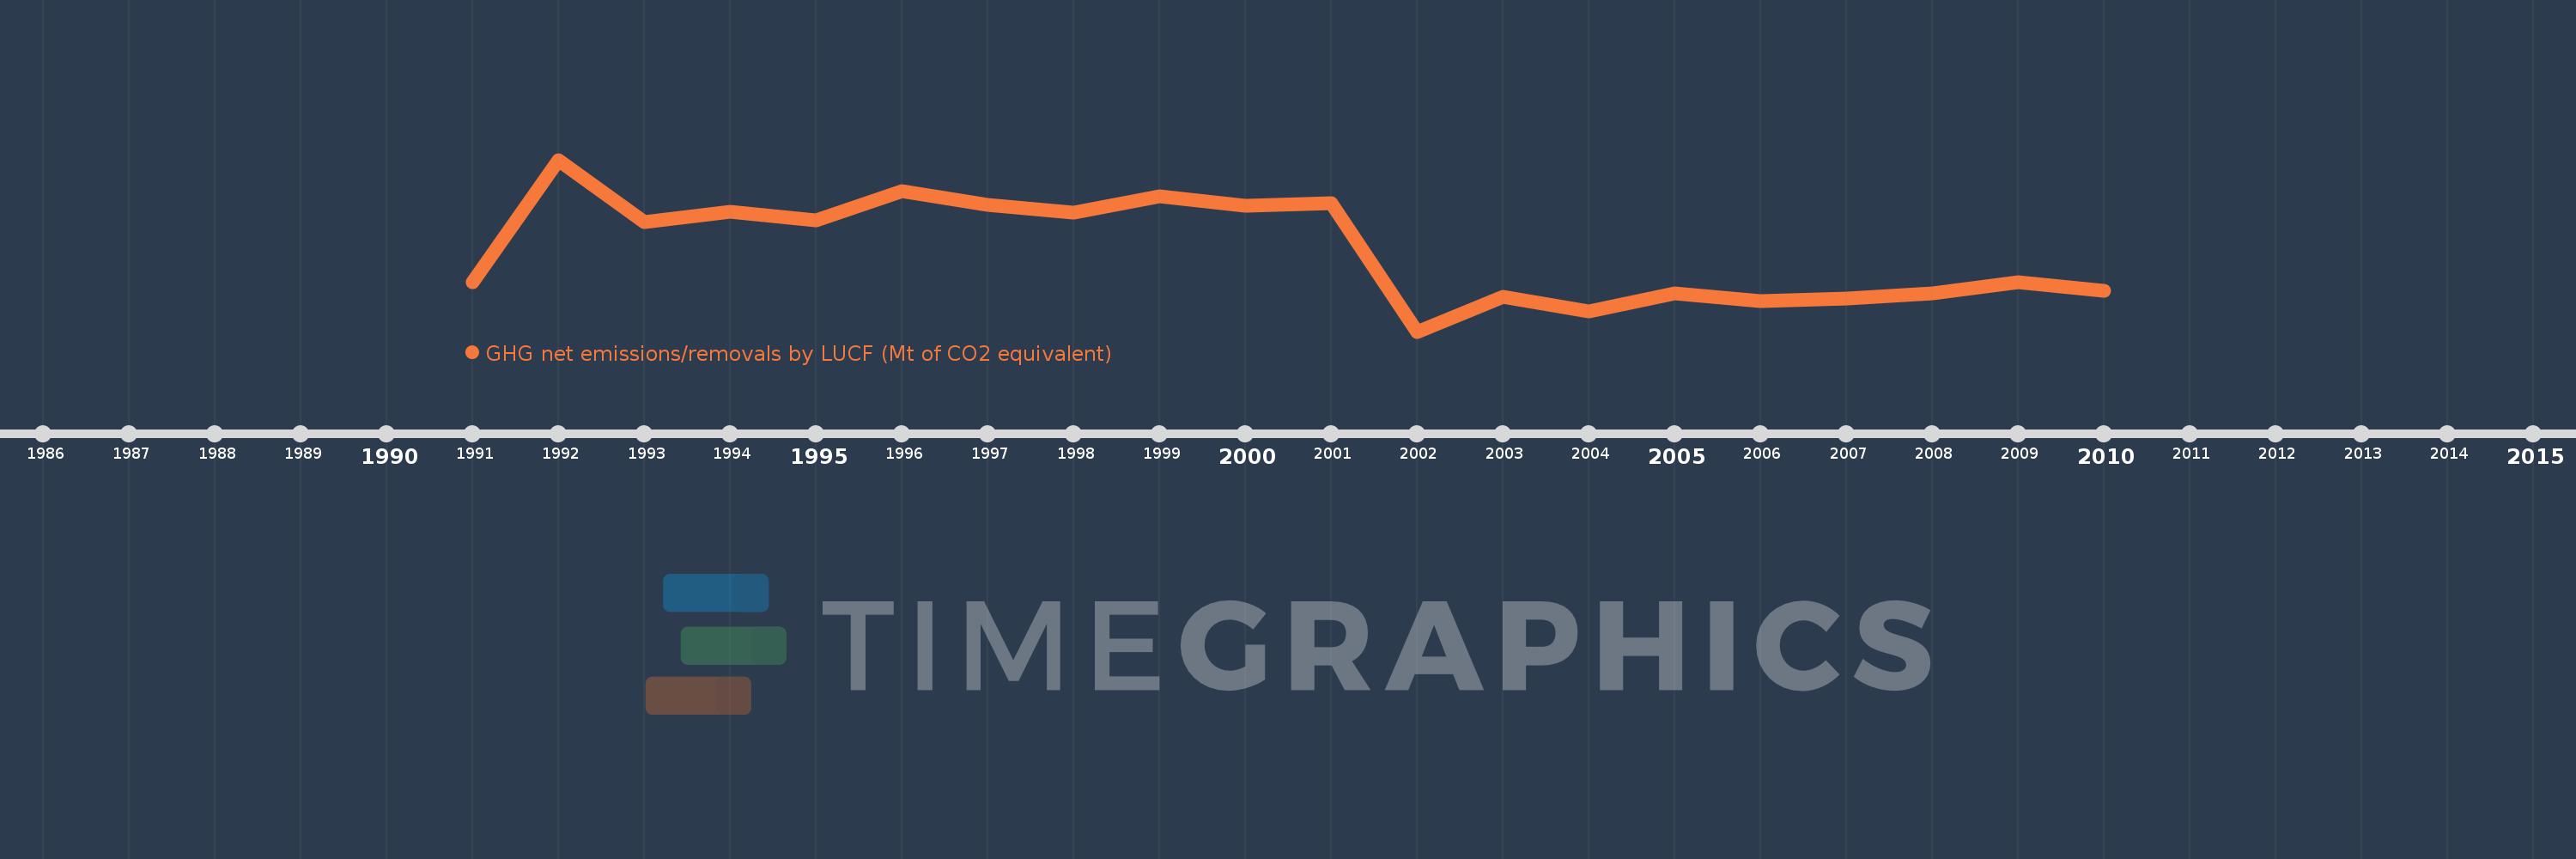
Questa scala temporale mostra un grafico dal 1991 anno al 2010 anno. Belgium. I dati fino ad 1990 anno non disponibili. Il numero di osservazioni attuali secondo i date: 20.
La fonte (nome):
Indicatori dello sviluppo mondiale
La fonte (organizzazione):
United Nations Framework Convention on Climate Change.
Categorie:
Climate Change, Environment
sono stati aggiornati
23 apr 2017 anni
Indicatori delle variazioni dei valori per anni
In media:
-1.396
Minima:
-1.804
1 gen 2002 anni
Massimo:
-0.94
1 gen 1992 anni
Alla data di osservazione
Valore
Variazione assoluta
La variazione rispetto al valore precedente
1 gen 1991 anni
-1.557
-1.557
0.0%
1 gen 1992 anni
-0.94
+0.616
-39.59%
1 gen 1993 anni
-1.254
-0.314
33.35%
1 gen 1994 anni
-1.202
+0.052
-4.13%
1 gen 1995 anni
-1.245
-0.043
3.55%
1 gen 1996 anni
-1.099
+0.146
-11.71%
1 gen 1997 anni
-1.166
-0.067
6.1%
1 gen 1998 anni
-1.205
-0.039
3.32%
1 gen 1999 anni
-1.122
+0.083
-6.88%
1 gen 2000 anni
-1.173
-0.051
4.51%
1 gen 2001 anni
-1.159
+0.013
-1.13%
1 gen 2002 anni
-1.804
-0.644
55.55%
1 gen 2003 anni
-1.628
+0.176
-9.74%
1 gen 2004 anni
-1.703
-0.075
4.63%
1 gen 2005 anni
-1.612
+0.092
-5.39%
1 gen 2006 anni
-1.65
-0.038
2.37%
1 gen 2007 anni
-1.637
+0.013
-0.76%
1 gen 2008 anni
-1.612
+0.025
-1.55%
1 gen 2009 anni
-1.556
+0.056
-3.46%
1 gen 2010 anni
-1.6
-0.044
2.84%
Classificazione dei paesi secondo i statistiche attuali per anni