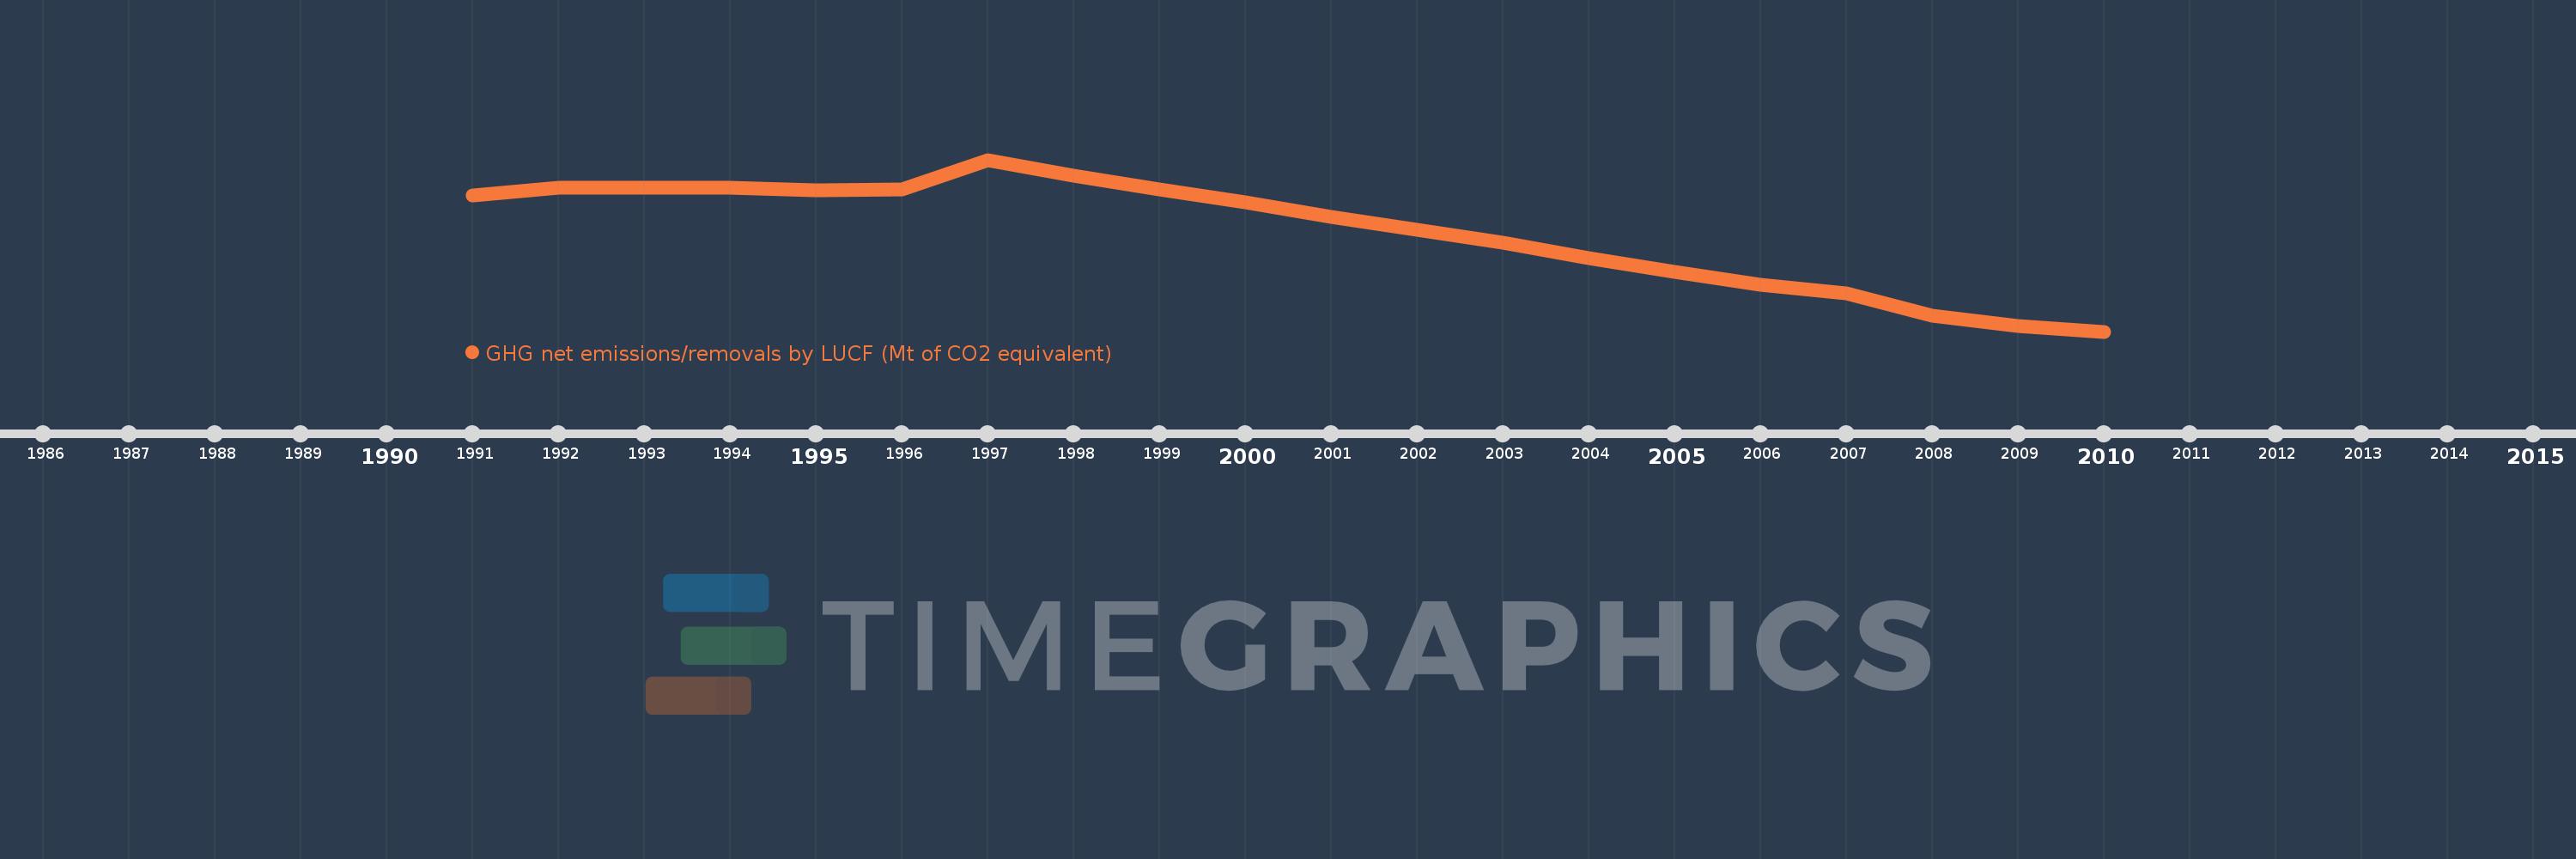
Questa scala temporale mostra un grafico dal 1991 anno al 2010 anno. Croatia. I dati fino ad 1990 anno non disponibili. Il numero di osservazioni attuali secondo i date: 20.
La fonte (nome):
Indicatori dello sviluppo mondiale
La fonte (organizzazione):
United Nations Framework Convention on Climate Change.
Categorie:
Climate Change, Environment
sono stati aggiornati
23 apr 2017 anni
Indicatori delle variazioni dei valori per anni
In media:
-7.412
Minima:
-8.712
1 gen 2010 anni
Massimo:
-6.472
1 gen 1997 anni
Alla data di osservazione
Valore
Variazione assoluta
La variazione rispetto al valore precedente
1 gen 1991 anni
-6.934
-6.934
0.0%
1 gen 1992 anni
-6.834
+0.1
-1.44%
1 gen 1993 anni
-6.832
+0.002
-0.03%
1 gen 1994 anni
-6.835
-0.003
0.04%
1 gen 1995 anni
-6.872
-0.037
0.55%
1 gen 1996 anni
-6.863
+0.009
-0.13%
1 gen 1997 anni
-6.472
+0.391
-5.7%
1 gen 1998 anni
-6.684
-0.213
3.28%
1 gen 1999 anni
-6.86
-0.176
2.63%
1 gen 2000 anni
-7.029
-0.169
2.46%
1 gen 2001 anni
-7.218
-0.189
2.69%
1 gen 2002 anni
-7.388
-0.17
2.36%
1 gen 2003 anni
-7.557
-0.169
2.28%
1 gen 2004 anni
-7.75
-0.193
2.56%
1 gen 2005 anni
-7.935
-0.185
2.38%
1 gen 2006 anni
-8.1
-0.165
2.09%
1 gen 2007 anni
-8.215
-0.115
1.43%
1 gen 2008 anni
-8.506
-0.29
3.53%
1 gen 2009 anni
-8.643
-0.137
1.61%
1 gen 2010 anni
-8.712
-0.069
0.8%
Classificazione dei paesi secondo i statistiche attuali per anni