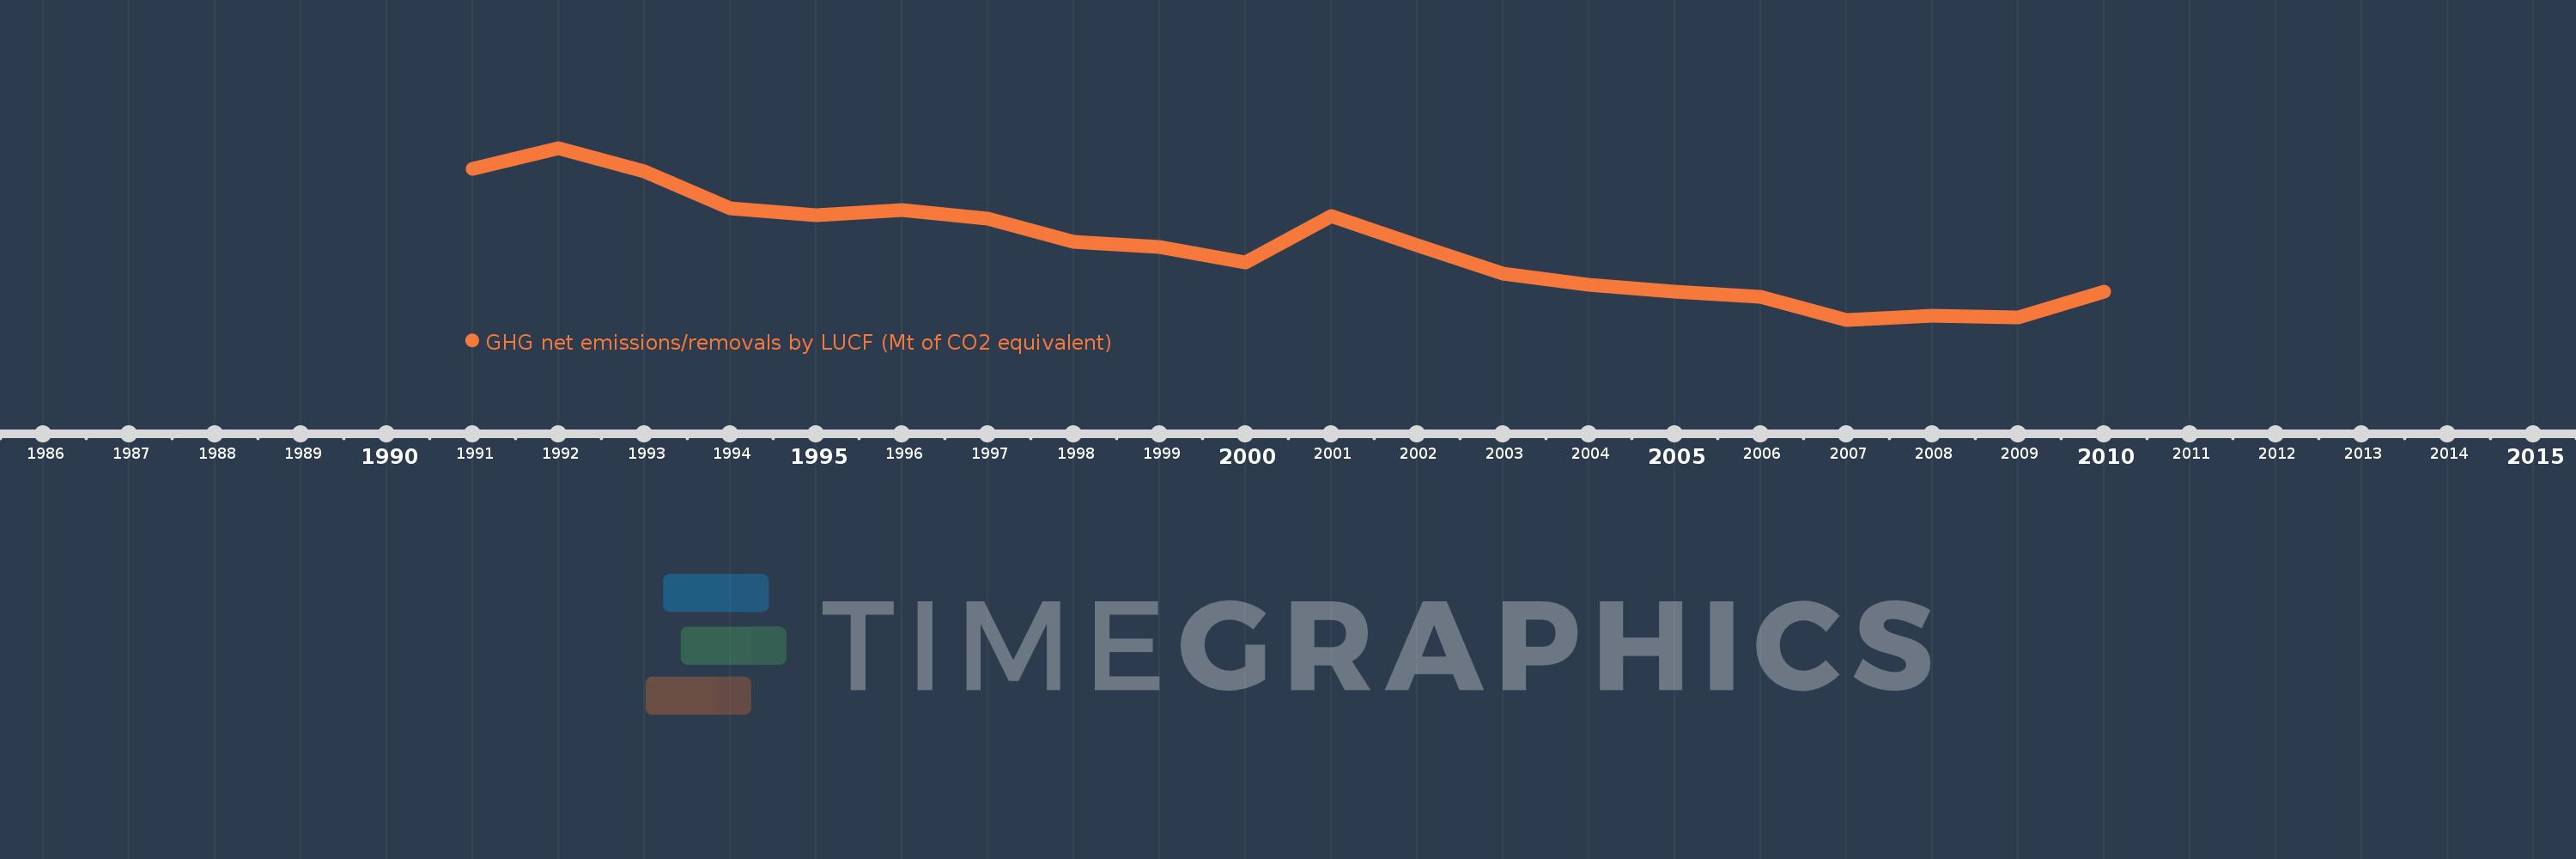
Questa scala temporale mostra un grafico dal 1991 anno al 2010 anno. France. I dati fino ad 1990 anno non disponibili. Il numero di osservazioni attuali secondo i date: 20.
La fonte (nome):
Indicatori dello sviluppo mondiale
La fonte (organizzazione):
United Nations Framework Convention on Climate Change.
Categorie:
Climate Change, Environment
sono stati aggiornati
23 apr 2017 anni
Indicatori delle variazioni dei valori per anni
In media:
-55.121
Minima:
-69.389
1 gen 2007 anni
Massimo:
-35.617
1 gen 1992 anni
Alla data di osservazione
Valore
Variazione assoluta
La variazione rispetto al valore precedente
1 gen 1991 anni
-39.699
-39.699
0.0%
1 gen 1992 anni
-35.617
+4.081
-10.28%
1 gen 1993 anni
-40.223
-4.605
12.93%
1 gen 1994 anni
-47.466
-7.243
18.01%
1 gen 1995 anni
-48.854
-1.388
2.92%
1 gen 1996 anni
-47.822
+1.032
-2.11%
1 gen 1997 anni
-49.464
-1.641
3.43%
1 gen 1998 anni
-54.147
-4.683
9.47%
1 gen 1999 anni
-55.078
-0.931
1.72%
1 gen 2000 anni
-58.13
-3.052
5.54%
1 gen 2001 anni
-49.051
+9.079
-15.62%
1 gen 2002 anni
-54.671
-5.62
11.46%
1 gen 2003 anni
-60.265
-5.594
10.23%
1 gen 2004 anni
-62.443
-2.178
3.61%
1 gen 2005 anni
-63.877
-1.434
2.3%
1 gen 2006 anni
-64.881
-1.004
1.57%
1 gen 2007 anni
-69.389
-4.508
6.95%
1 gen 2008 anni
-68.519
+0.87
-1.25%
1 gen 2009 anni
-68.903
-0.384
0.56%
1 gen 2010 anni
-63.92
+4.983
-7.23%
Classificazione dei paesi secondo i statistiche attuali per anni