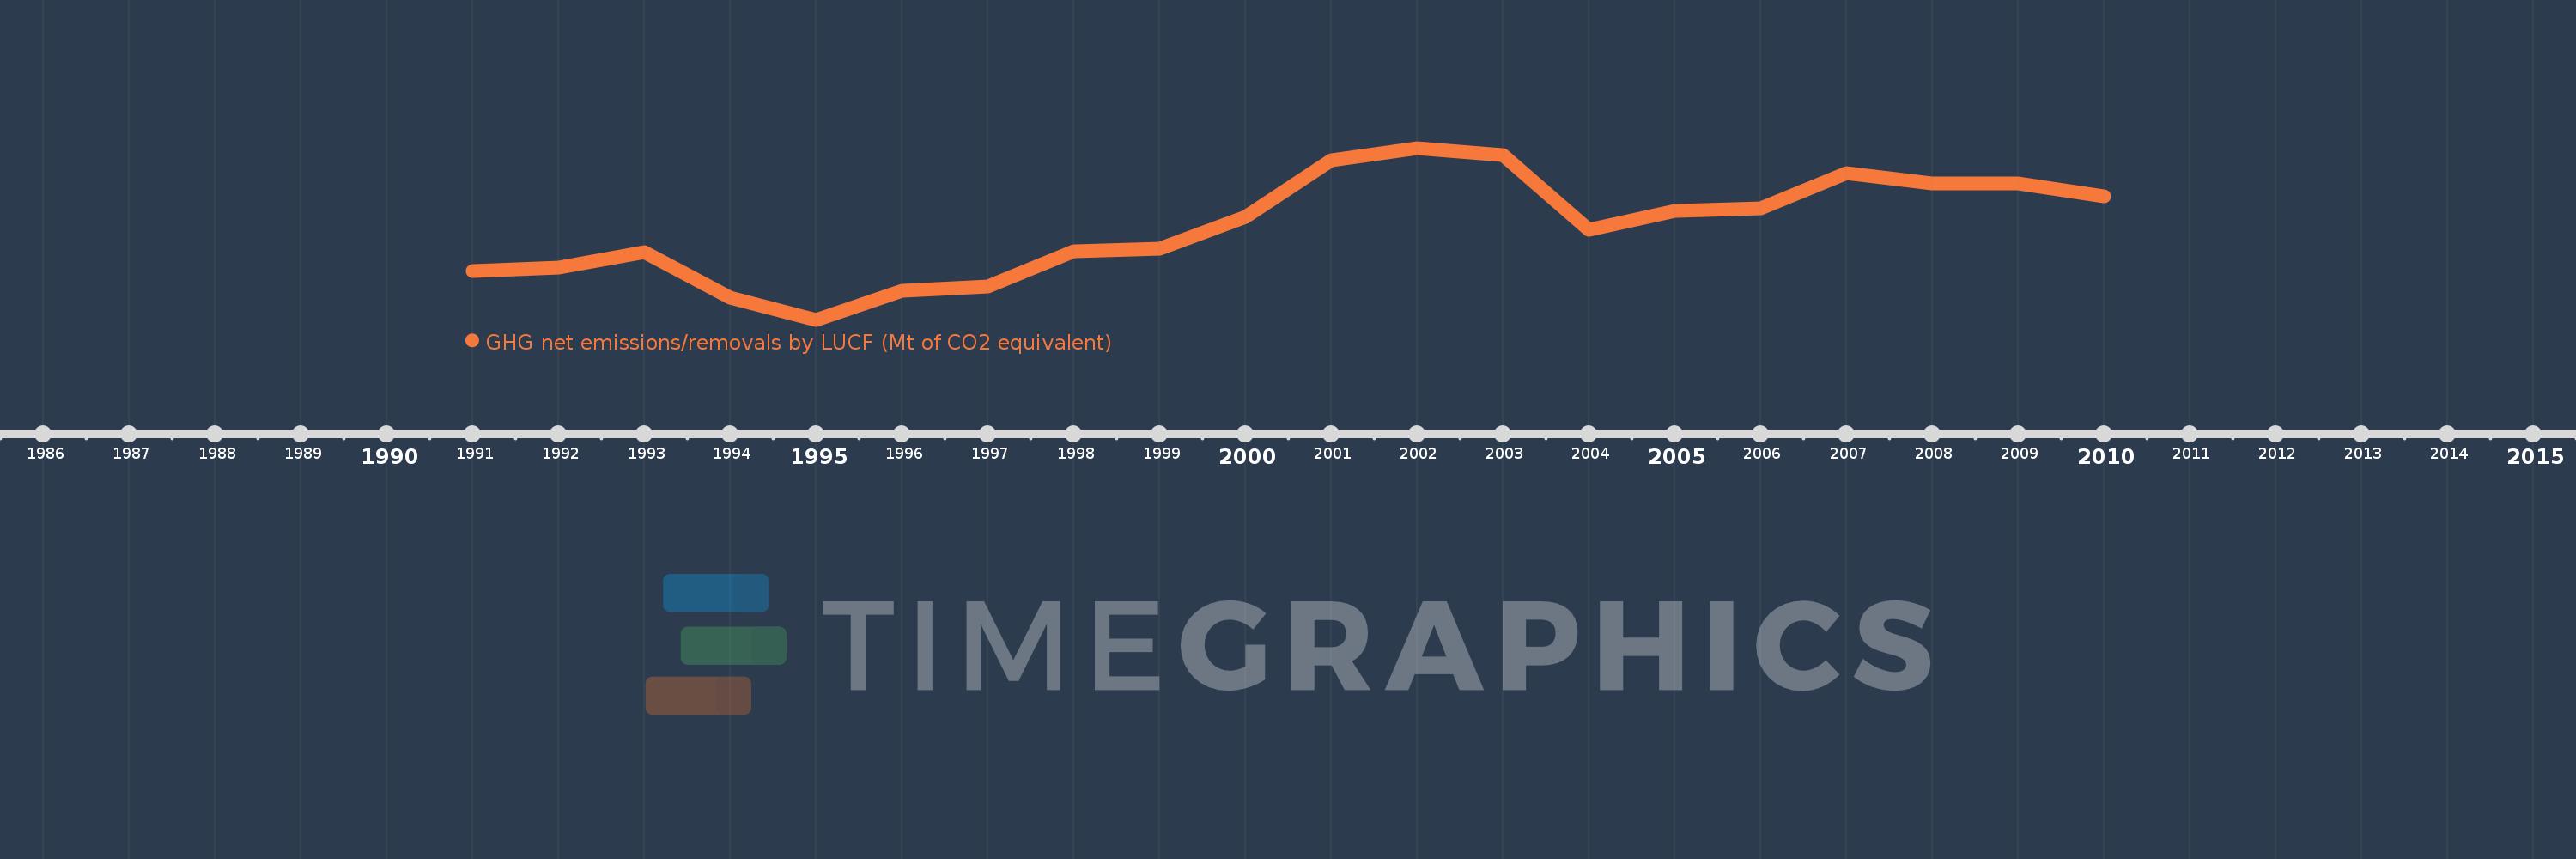
Questa scala temporale mostra un grafico dal 1991 anno al 2010 anno. Switzerland. I dati fino ad 1990 anno non disponibili. Il numero di osservazioni attuali secondo i date: 20.
La fonte (nome):
Indicatori dello sviluppo mondiale
La fonte (organizzazione):
United Nations Framework Convention on Climate Change.
Categorie:
Climate Change, Environment
sono stati aggiornati
23 apr 2017 anni
Indicatori delle variazioni dei valori per anni
In media:
-1.087
Minima:
-4.539
1 gen 1995 anni
Massimo:
1.894
1 gen 2002 anni
Alla data di osservazione
Valore
Variazione assoluta
La variazione rispetto al valore precedente
1 gen 1991 anni
-2.725
-2.725
0.0%
1 gen 1992 anni
-2.589
+0.136
-4.98%
1 gen 1993 anni
-2.009
+0.581
-22.43%
1 gen 1994 anni
-3.703
-1.695
84.37%
1 gen 1995 anni
-4.539
-0.835
22.56%
1 gen 1996 anni
-3.461
+1.078
-23.75%
1 gen 1997 anni
-3.296
+0.165
-4.77%
1 gen 1998 anni
-1.99
+1.306
-39.62%
1 gen 1999 anni
-1.888
+0.102
-5.14%
1 gen 2000 anni
-0.704
+1.183
-62.68%
1 gen 2001 anni
1.442
+2.146
-304.7%
1 gen 2002 anni
1.894
+0.452
31.38%
1 gen 2003 anni
1.634
-0.261
-13.75%
1 gen 2004 anni
-1.168
-2.801
-171.46%
1 gen 2005 anni
-0.454
+0.713
-61.1%
1 gen 2006 anni
-0.373
+0.081
-17.82%
1 gen 2007 anni
0.952
+1.325
-355.08%
1 gen 2008 anni
0.569
-0.383
-40.26%
1 gen 2009 anni
0.574
+0.005
0.93%
1 gen 2010 anni
0.089
-0.486
-84.58%
Classificazione dei paesi secondo i statistiche attuali per anni