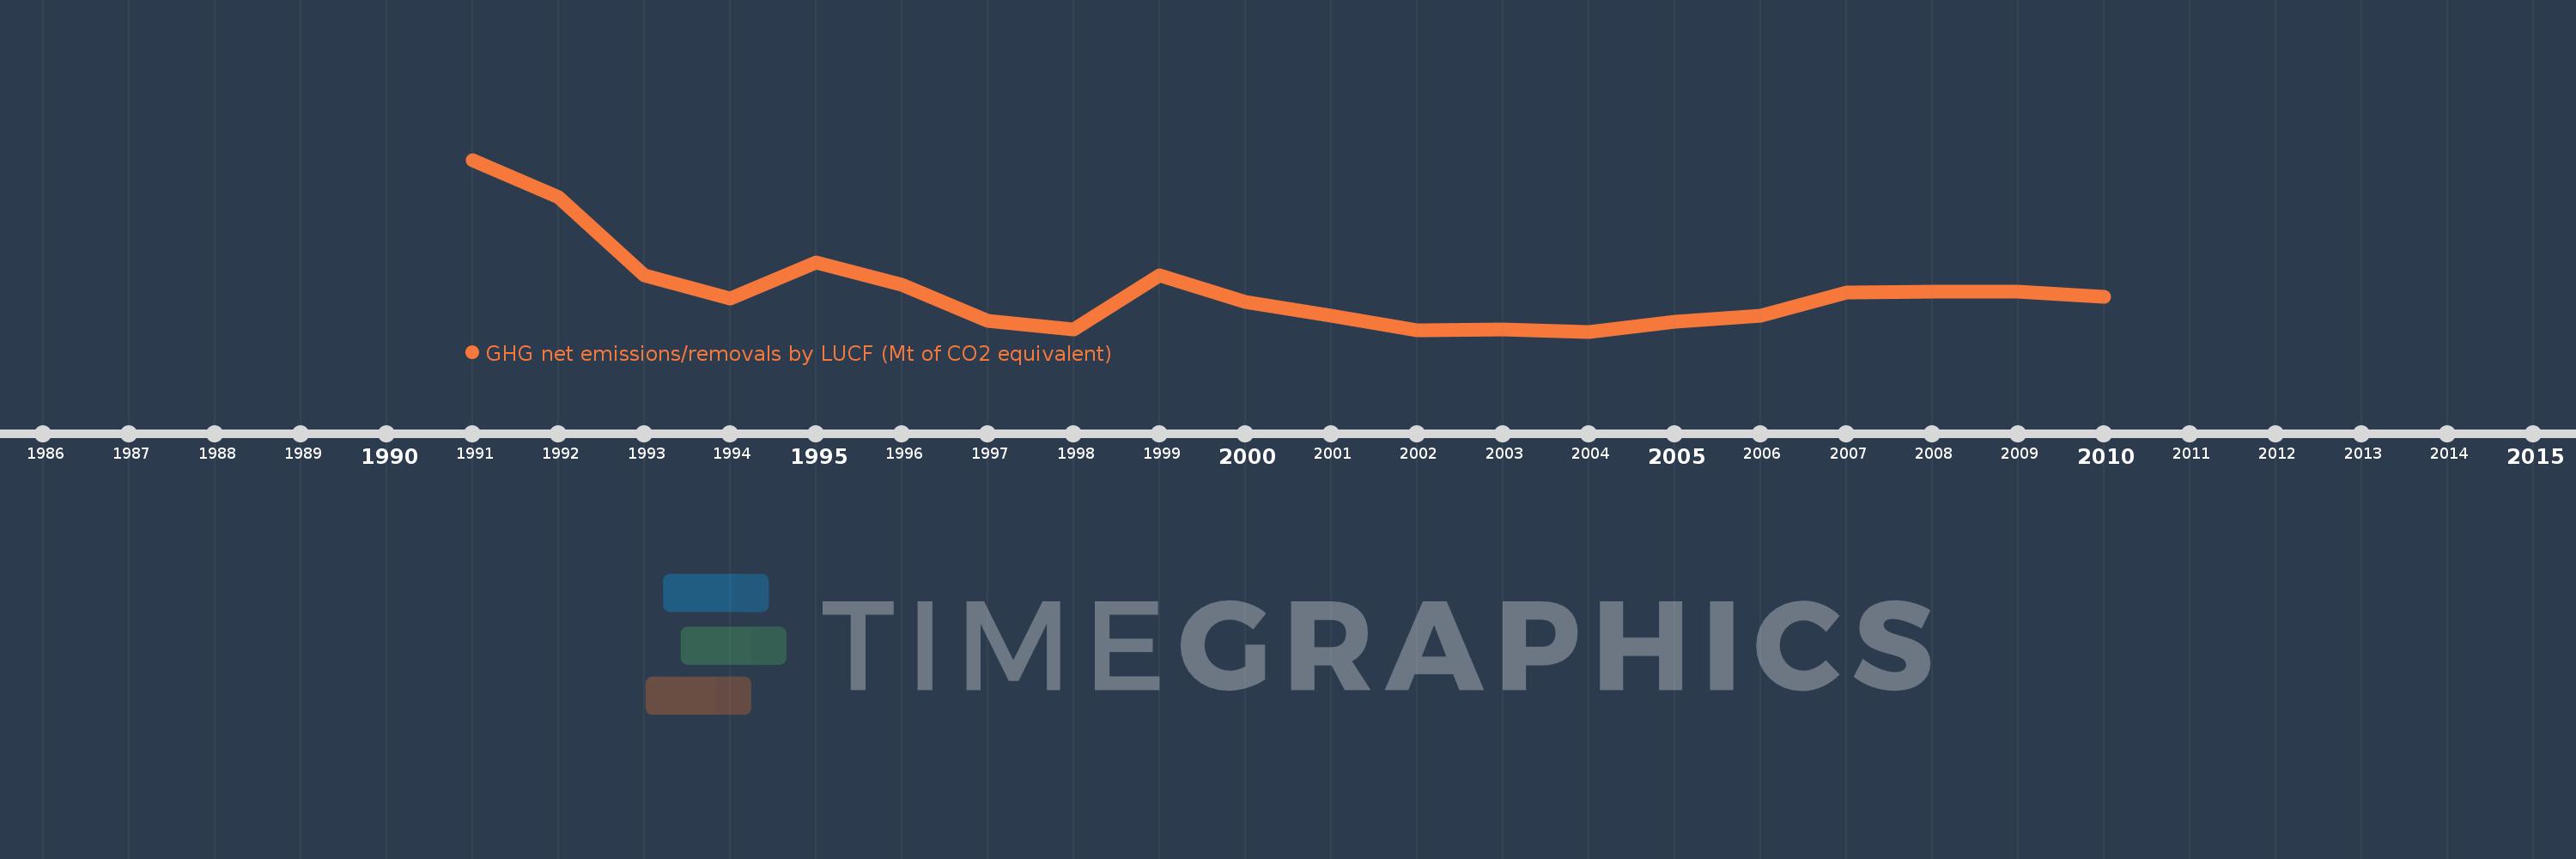
Questa scala temporale mostra un grafico dal 1991 anno al 2010 anno. Luxembourg. I dati fino ad 1990 anno non disponibili. Il numero di osservazioni attuali secondo i date: 20.
La fonte (nome):
Indicatori dello sviluppo mondiale
La fonte (organizzazione):
United Nations Framework Convention on Climate Change.
Categorie:
Climate Change, Environment
sono stati aggiornati
23 apr 2017 anni
Indicatori delle variazioni dei valori per anni
In media:
-0.27
Minima:
-0.46
1 gen 2004 anni
Massimo:
0.348
1 gen 1991 anni
Alla data di osservazione
Valore
Variazione assoluta
La variazione rispetto al valore precedente
1 gen 1991 anni
0.348
+0.348
0.0%
1 gen 1992 anni
0.172
-0.175
-50.42%
1 gen 1993 anni
-0.196
-0.368
-213.53%
1 gen 1994 anni
-0.306
-0.11
56.23%
1 gen 1995 anni
-0.136
+0.17
-55.54%
1 gen 1996 anni
-0.238
-0.102
75.13%
1 gen 1997 anni
-0.411
-0.173
72.47%
1 gen 1998 anni
-0.451
-0.04
9.85%
1 gen 1999 anni
-0.195
+0.256
-56.66%
1 gen 2000 anni
-0.319
-0.123
63.08%
1 gen 2001 anni
-0.385
-0.067
20.89%
1 gen 2002 anni
-0.452
-0.066
17.16%
1 gen 2003 anni
-0.451
+0.0
-0.07%
1 gen 2004 anni
-0.46
-0.008
1.88%
1 gen 2005 anni
-0.414
+0.045
-9.84%
1 gen 2006 anni
-0.386
+0.029
-6.96%
1 gen 2007 anni
-0.276
+0.11
-28.54%
1 gen 2008 anni
-0.273
+0.002
-0.88%
1 gen 2009 anni
-0.272
+0.001
-0.31%
1 gen 2010 anni
-0.296
-0.024
8.85%
Classificazione dei paesi secondo i statistiche attuali per anni