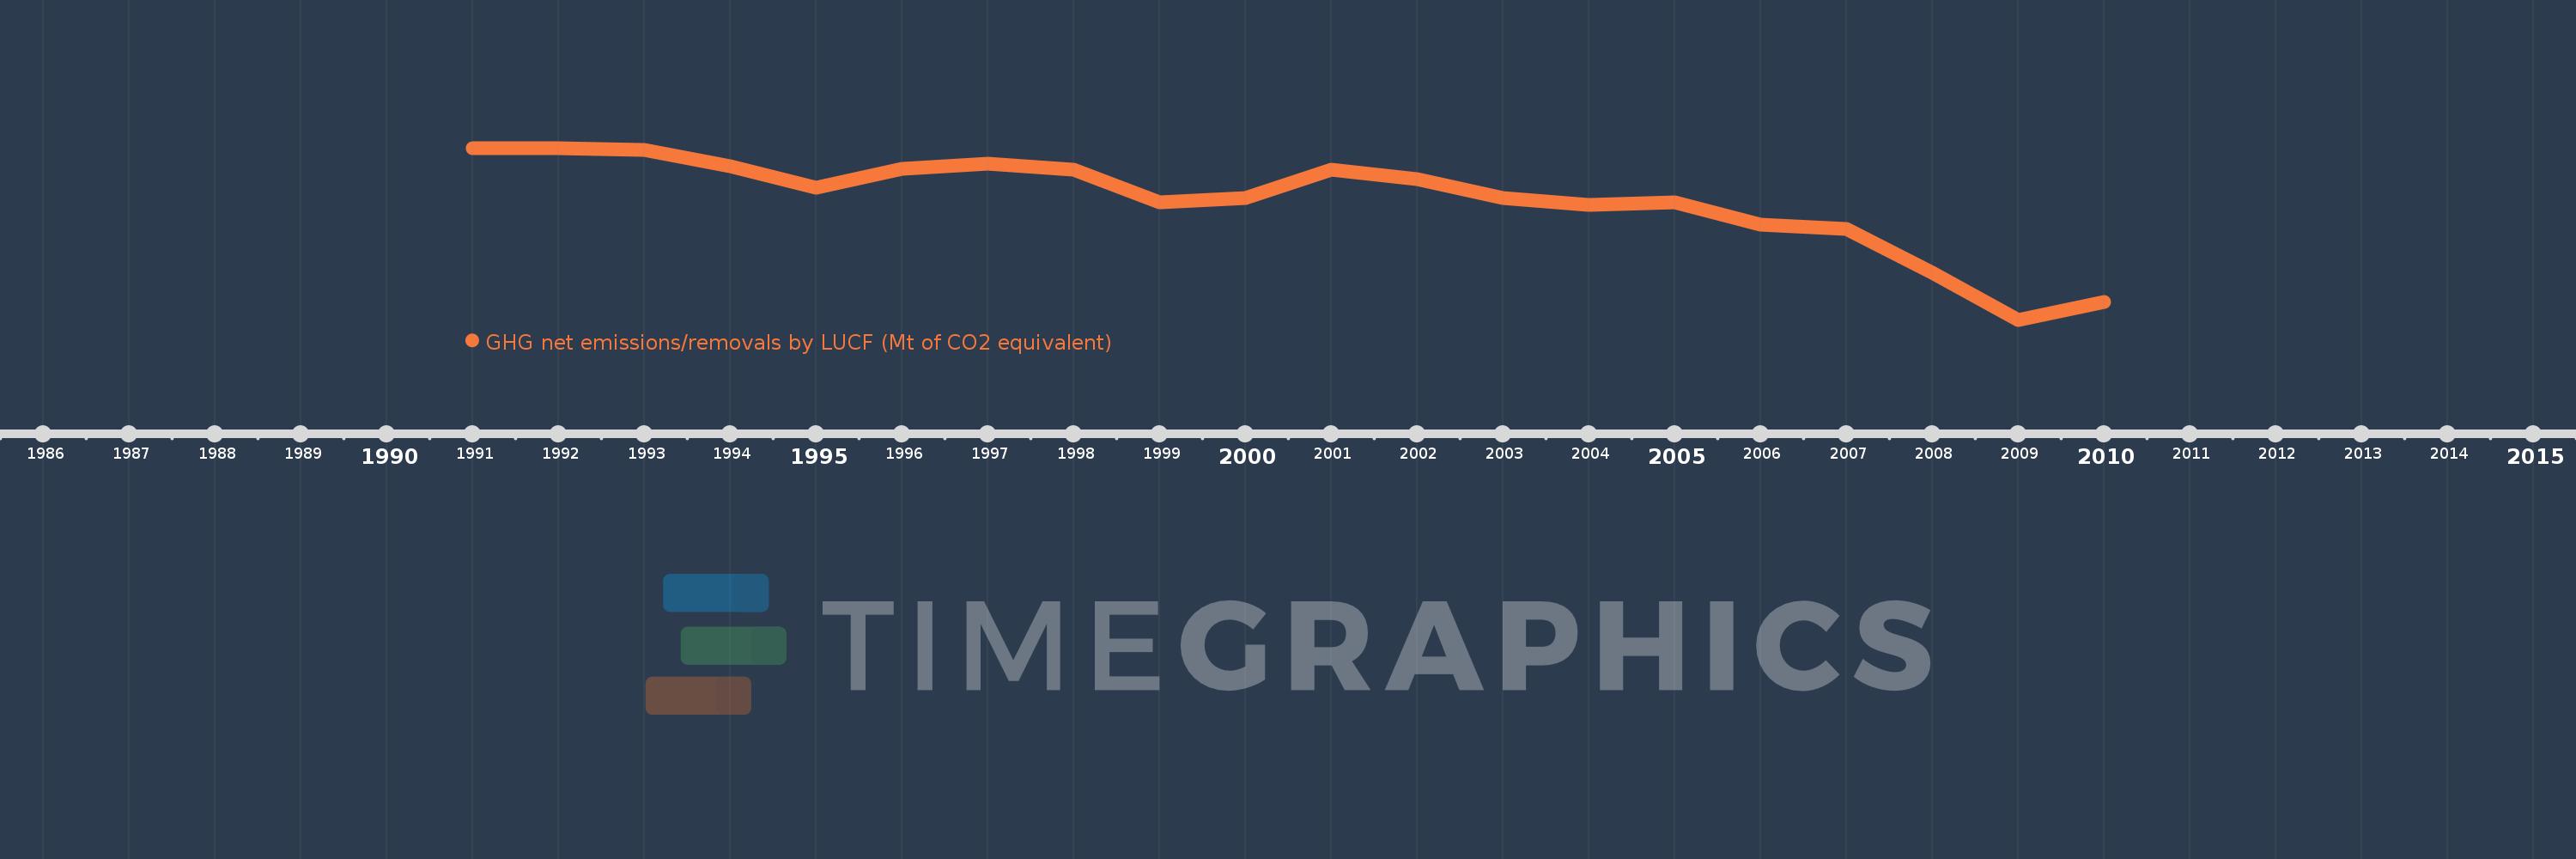
Questa scala temporale mostra un grafico dal 1991 anno al 2010 anno. Ireland. I dati fino ad 1990 anno non disponibili. Il numero di osservazioni attuali secondo i date: 20.
La fonte (nome):
Indicatori dello sviluppo mondiale
La fonte (organizzazione):
United Nations Framework Convention on Climate Change.
Categorie:
Climate Change, Environment
sono stati aggiornati
23 apr 2017 anni
Indicatori delle variazioni dei valori per anni
In media:
-1.11
Minima:
-2.357
1 gen 2009 anni
Massimo:
-0.565
1 gen 1991 anni
Alla data di osservazione
Valore
Variazione assoluta
La variazione rispetto al valore precedente
1 gen 1991 anni
-0.565
-0.565
0.0%
1 gen 1992 anni
-0.57
-0.005
0.8%
1 gen 1993 anni
-0.584
-0.015
2.61%
1 gen 1994 anni
-0.757
-0.173
29.62%
1 gen 1995 anni
-0.982
-0.225
29.67%
1 gen 1996 anni
-0.785
+0.198
-20.12%
1 gen 1997 anni
-0.725
+0.06
-7.59%
1 gen 1998 anni
-0.791
-0.066
9.14%
1 gen 1999 anni
-1.132
-0.34
43.01%
1 gen 2000 anni
-1.084
+0.047
-4.19%
1 gen 2001 anni
-0.788
+0.296
-27.3%
1 gen 2002 anni
-0.891
-0.102
12.99%
1 gen 2003 anni
-1.085
-0.195
21.84%
1 gen 2004 anni
-1.162
-0.077
7.08%
1 gen 2005 anni
-1.134
+0.028
-2.39%
1 gen 2006 anni
-1.364
-0.23
20.29%
1 gen 2007 anni
-1.406
-0.042
3.07%
1 gen 2008 anni
-1.87
-0.464
33.0%
1 gen 2009 anni
-2.357
-0.487
26.06%
1 gen 2010 anni
-2.173
+0.184
-7.82%
Classificazione dei paesi secondo i statistiche attuali per anni