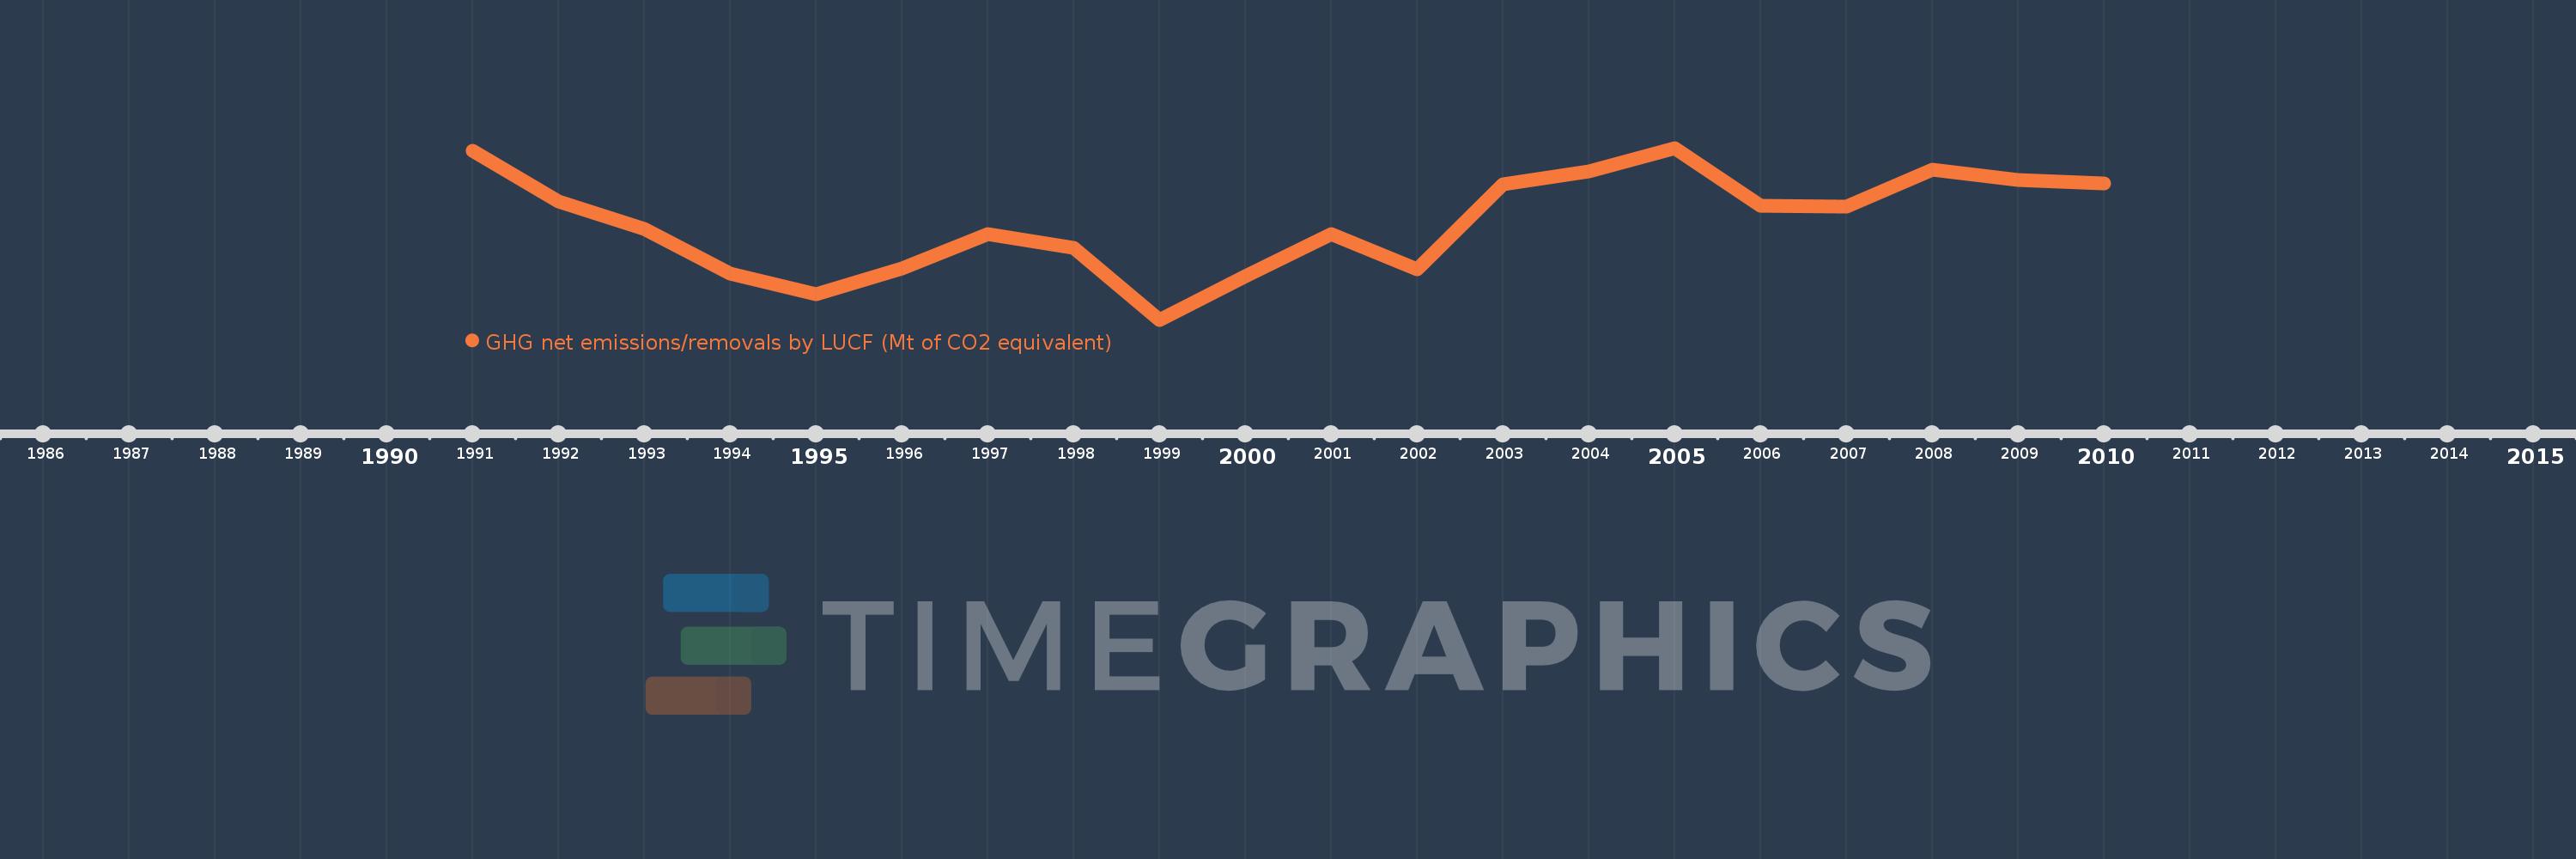
Questa scala temporale mostra un grafico dal 1991 anno al 2010 anno. Romania. I dati fino ad 1990 anno non disponibili. Il numero di osservazioni attuali secondo i date: 20.
La fonte (nome):
Indicatori dello sviluppo mondiale
La fonte (organizzazione):
United Nations Framework Convention on Climate Change.
Categorie:
Climate Change, Environment
sono stati aggiornati
23 apr 2017 anni
Indicatori delle variazioni dei valori per anni
In media:
-37.653
Minima:
-40.481
1 gen 1999 anni
Massimo:
-35.492
1 gen 2005 anni
Alla data di osservazione
Valore
Variazione assoluta
La variazione rispetto al valore precedente
1 gen 1991 anni
-35.583
-35.583
0.0%
1 gen 1992 anni
-37.041
-1.458
4.1%
1 gen 1993 anni
-37.846
-0.804
2.17%
1 gen 1994 anni
-39.131
-1.285
3.4%
1 gen 1995 anni
-39.734
-0.603
1.54%
1 gen 1996 anni
-38.987
+0.747
-1.88%
1 gen 1997 anni
-38.003
+0.985
-2.53%
1 gen 1998 anni
-38.39
-0.387
1.02%
1 gen 1999 anni
-40.481
-2.091
5.45%
1 gen 2000 anni
-39.208
+1.273
-3.14%
1 gen 2001 anni
-37.999
+1.209
-3.08%
1 gen 2002 anni
-39.007
-1.008
2.65%
1 gen 2003 anni
-36.536
+2.471
-6.34%
1 gen 2004 anni
-36.174
+0.362
-0.99%
1 gen 2005 anni
-35.492
+0.682
-1.88%
1 gen 2006 anni
-37.181
-1.689
4.76%
1 gen 2007 anni
-37.2
-0.019
0.05%
1 gen 2008 anni
-36.114
+1.085
-2.92%
1 gen 2009 anni
-36.415
-0.3
0.83%
1 gen 2010 anni
-36.533
-0.119
0.33%
Classificazione dei paesi secondo i statistiche attuali per anni