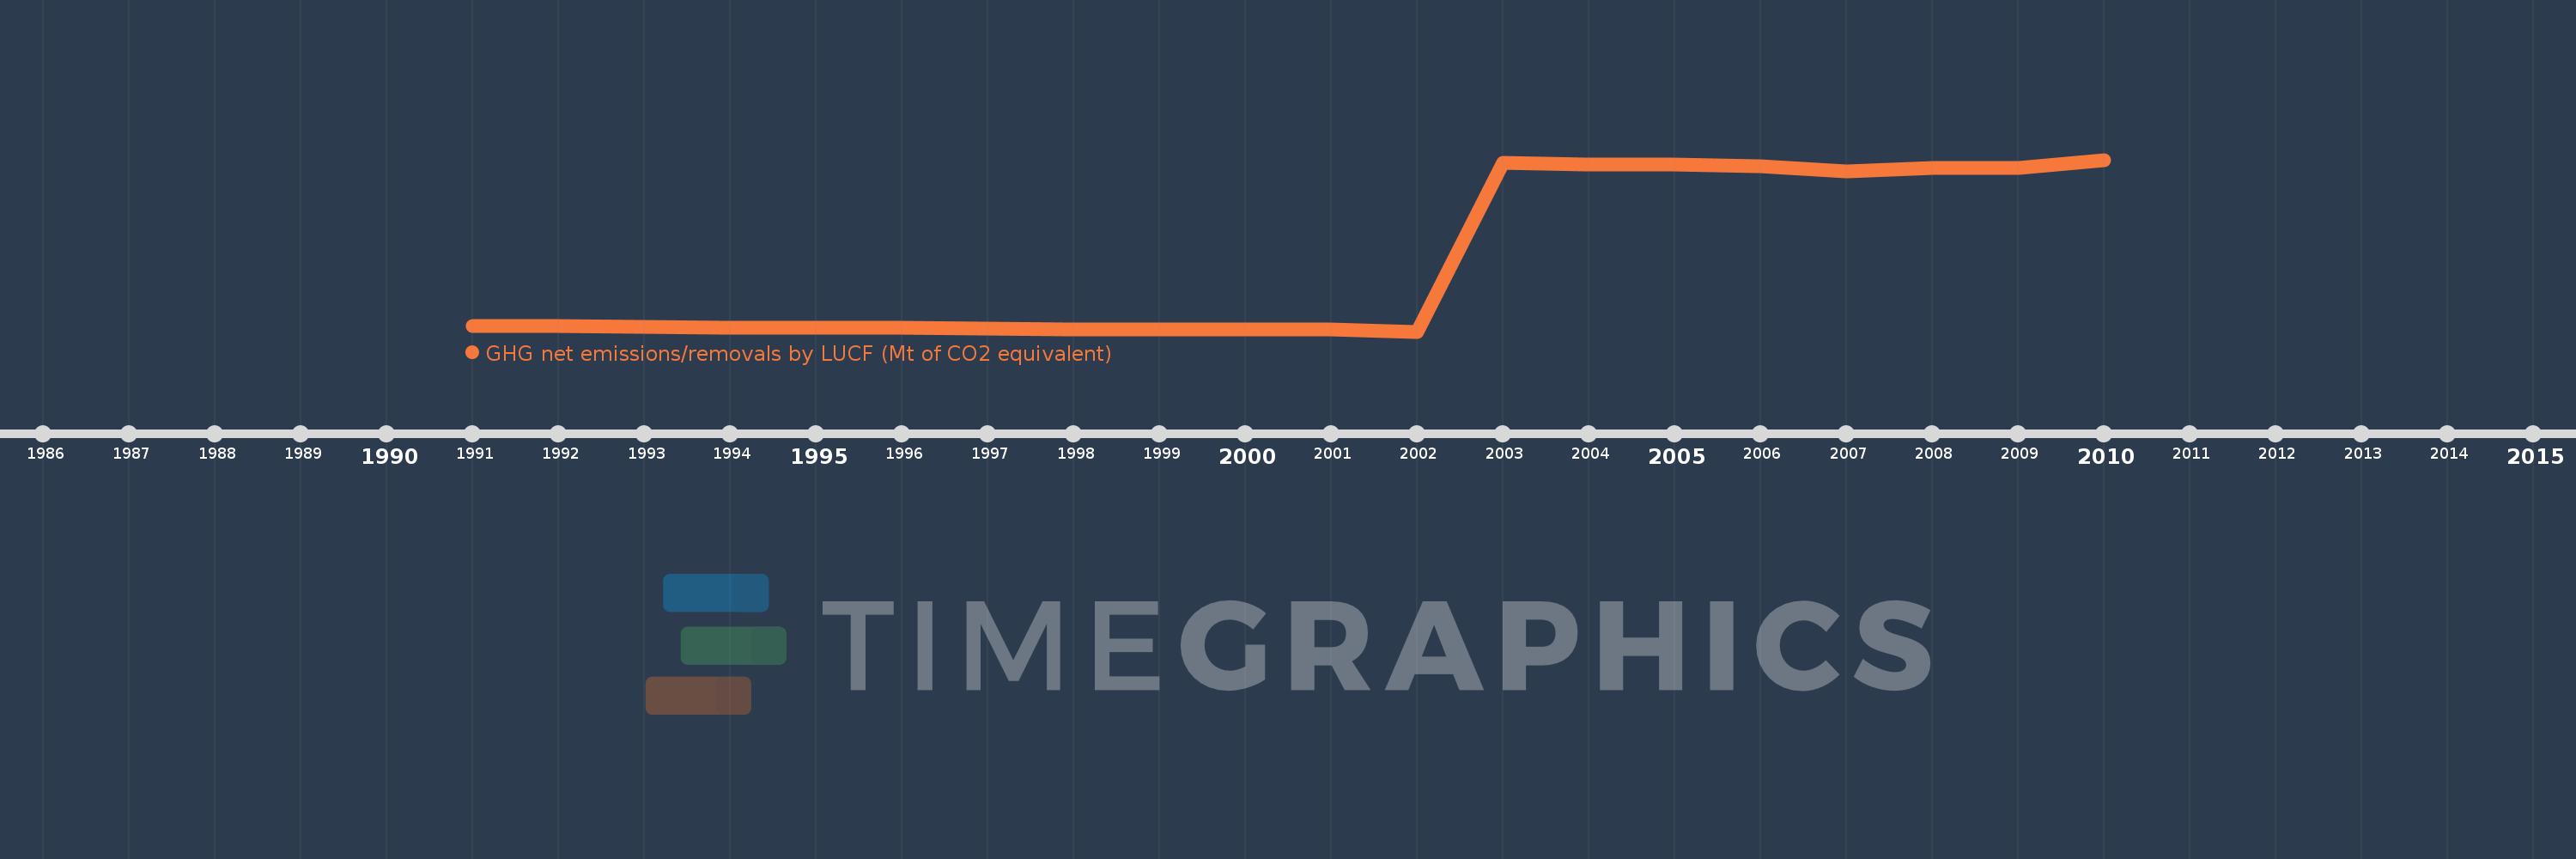
Questa scala temporale mostra un grafico dal 1991 anno al 2010 anno. Germany. I dati fino ad 1990 anno non disponibili. Il numero di osservazioni attuali secondo i date: 20.
La fonte (nome):
Indicatori dello sviluppo mondiale
La fonte (organizzazione):
United Nations Framework Convention on Climate Change.
Categorie:
Climate Change, Environment
sono stati aggiornati
23 apr 2017 anni
Indicatori delle variazioni dei valori per anni
In media:
-12.856
Minima:
-32.923
1 gen 2002 anni
Massimo:
17.563
1 gen 2010 anni
Alla data di osservazione
Valore
Variazione assoluta
La variazione rispetto al valore precedente
1 gen 1991 anni
-31.175
-31.175
0.0%
1 gen 1992 anni
-31.377
-0.202
0.65%
1 gen 1993 anni
-31.608
-0.231
0.74%
1 gen 1994 anni
-31.856
-0.249
0.79%
1 gen 1995 anni
-31.872
-0.015
0.05%
1 gen 1996 anni
-31.849
+0.023
-0.07%
1 gen 1997 anni
-32.052
-0.203
0.64%
1 gen 1998 anni
-32.184
-0.132
0.41%
1 gen 1999 anni
-32.214
-0.029
0.09%
1 gen 2000 anni
-32.366
-0.153
0.47%
1 gen 2001 anni
-32.384
-0.018
0.05%
1 gen 2002 anni
-32.923
-0.539
1.67%
1 gen 2003 anni
16.619
+49.543
-150.48%
1 gen 2004 anni
16.269
-0.35
-2.11%
1 gen 2005 anni
16.056
-0.213
-1.31%
1 gen 2006 anni
15.761
-0.295
-1.84%
1 gen 2007 anni
14.074
-1.686
-10.7%
1 gen 2008 anni
15.188
+1.114
7.91%
1 gen 2009 anni
15.216
+0.028
0.19%
1 gen 2010 anni
17.563
+2.347
15.42%
Classificazione dei paesi secondo i statistiche attuali per anni