29
/
en
AIzaSyAYiBZKx7MnpbEhh9jyipgxe19OcubqV5w
April 1, 2024
93373
Bulgaria
BGR
true
2
1
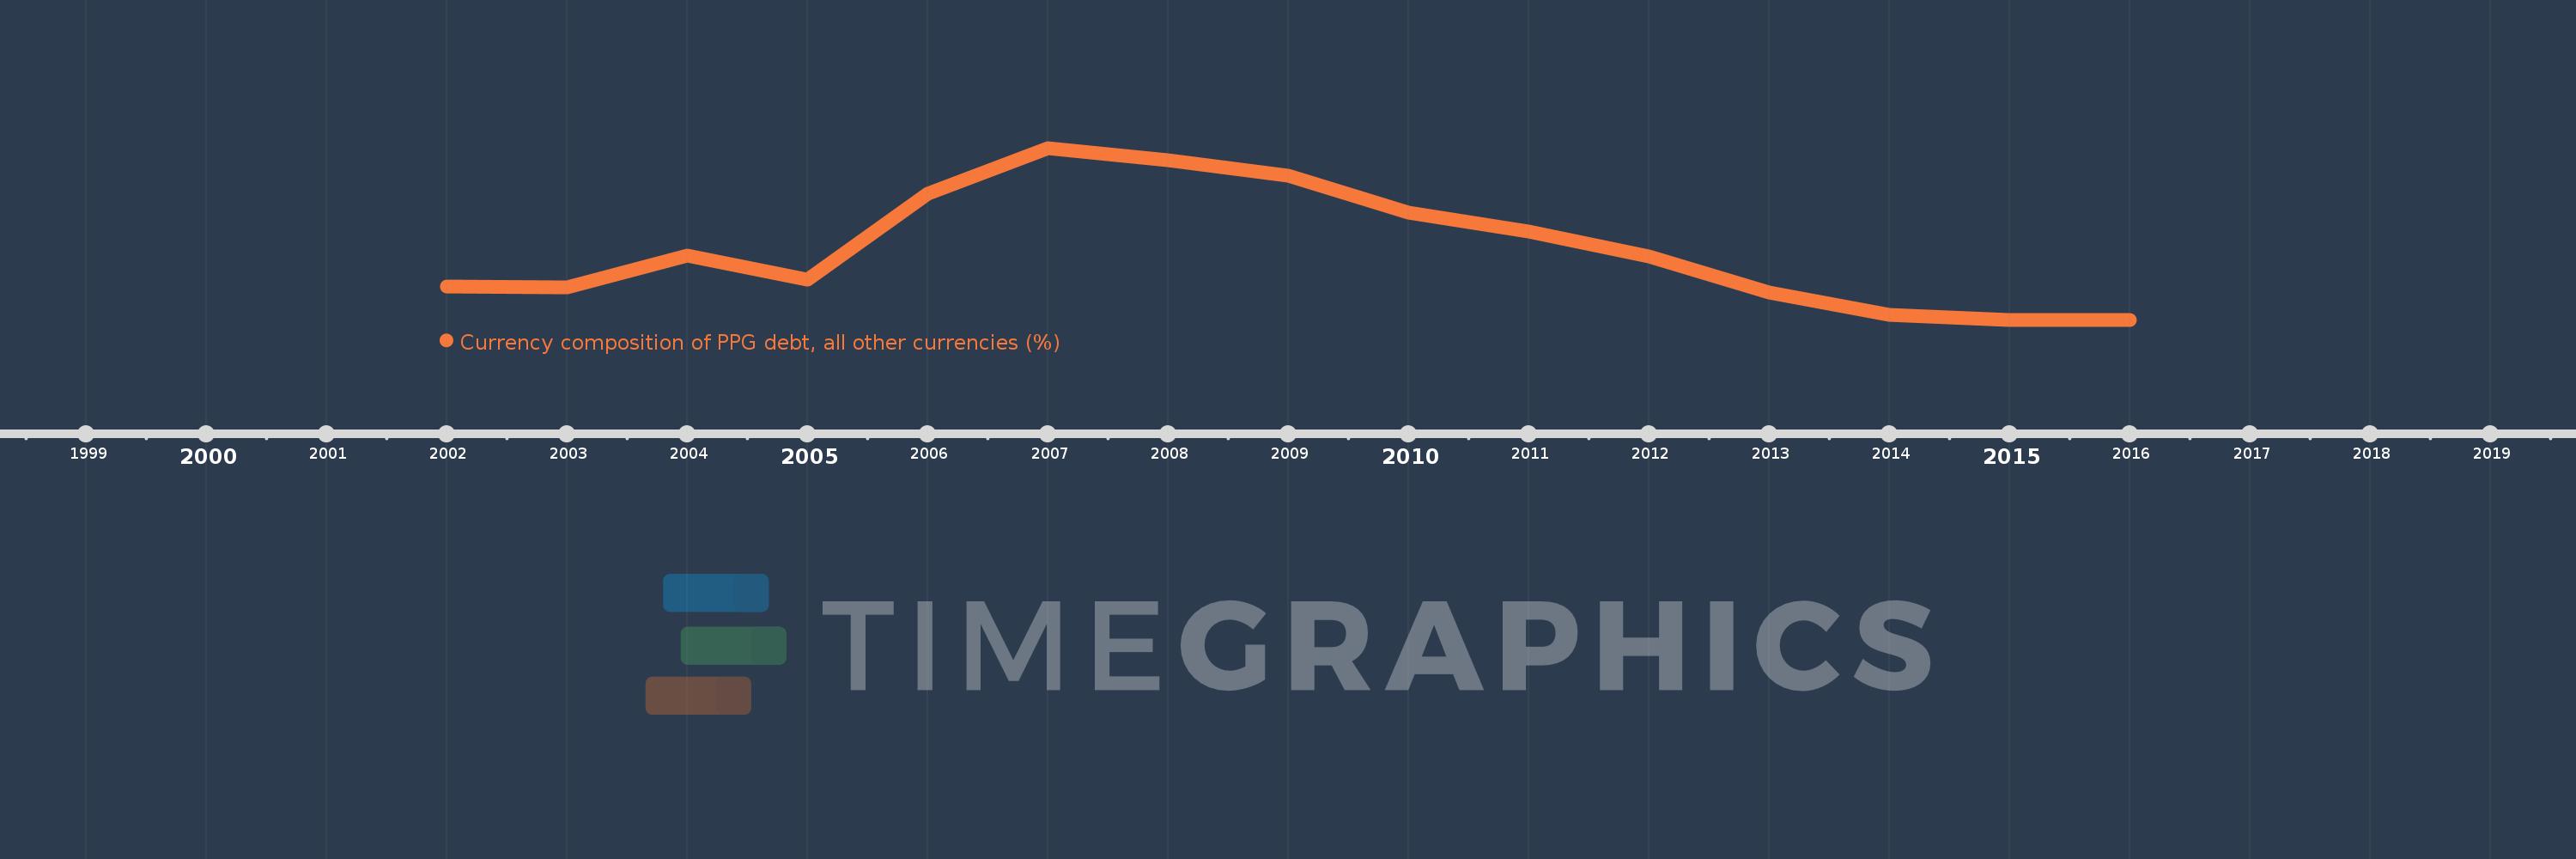
Currency composition of PPG debt, all other currencies (%)
2016,2015,2014,2013,2012,2011,2010,2009,2008,2007,2006,2005,2004,2003,2002
This statistics in other country:
Timeline:
This timeline shows a graph from 2002 to 2016 of Bulgaria. No data until 2001. Number of actual observations by date: 15.
Source name:
World Development Indicators
Source organization:
World Bank, International Debt Statistics.
Categories, topics:
External Debt
Last updated:
apr 23, 2017
Indicators value changes by year
At the date of observation
Value
Absolute change
Change from previous value
jan 1, 2002
0.091
+0.091
0.0%
jan 1, 2003
0.089
-0.002
-1.86%
jan 1, 2004
0.175
+0.085
95.31%
jan 1, 2005
0.109
-0.065
-37.36%
jan 1, 2006
0.342
+0.232
211.96%
jan 1, 2007
0.467
+0.126
36.83%
jan 1, 2008
0.434
-0.034
-7.19%
jan 1, 2009
0.392
-0.041
-9.54%
jan 1, 2010
0.291
-0.102
-25.94%
jan 1, 2011
0.24
-0.051
-17.52%
jan 1, 2012
0.173
-0.067
-27.83%
jan 1, 2013
0.074
-0.099
-57.05%
jan 1, 2014
0.014
-0.06
-80.62%
jan 1, 2015
0.0
-0.014
-98.61%
Ranking of countries by current statistics by years


Comments: