29
/
en
AIzaSyAYiBZKx7MnpbEhh9jyipgxe19OcubqV5w
April 1, 2024
113416
Cote d'Ivoire
CIV
true
2
1
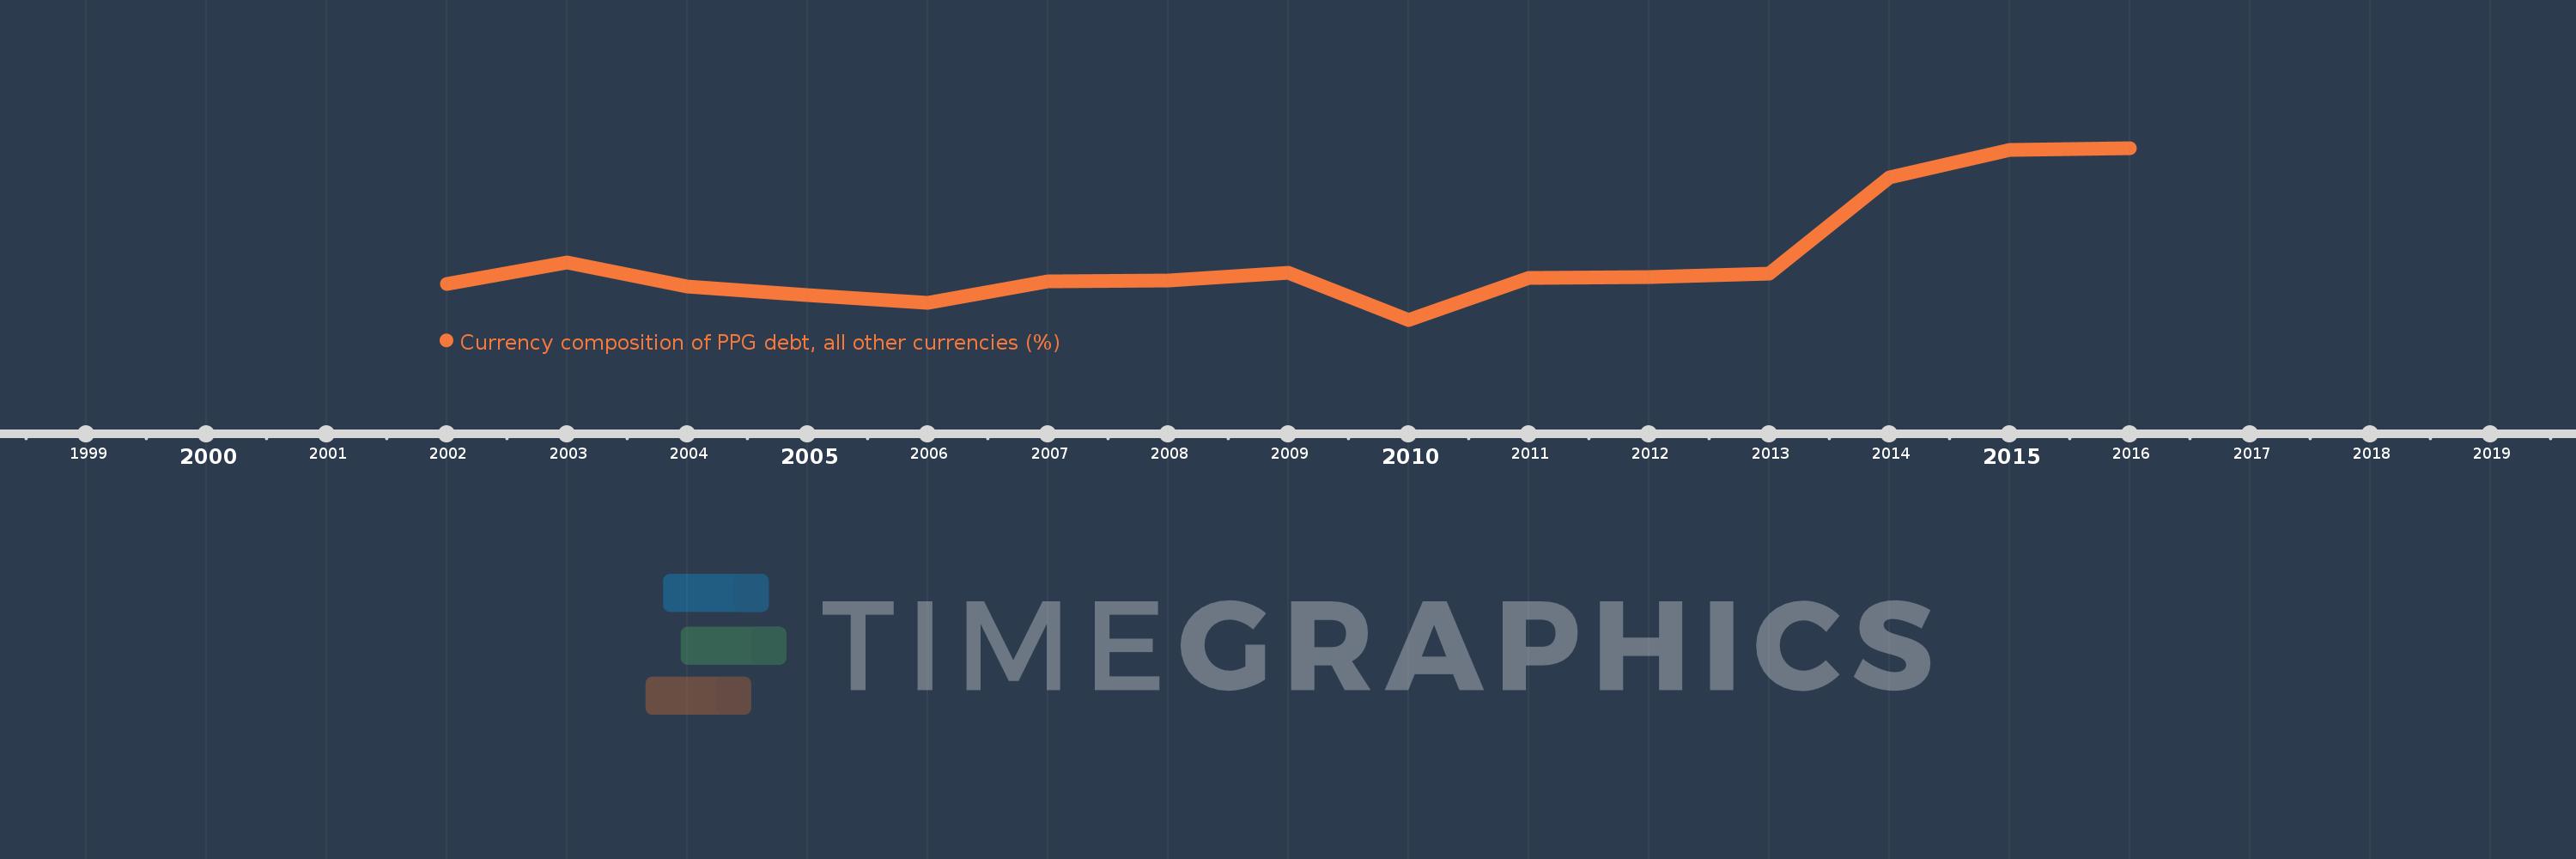
Currency composition of PPG debt, all other currencies (%)
2016,2015,2014,2013,2012,2011,2010,2009,2008,2007,2006,2005,2004,2003,2002
This statistics in other country:
Timeline:
This timeline shows a graph from 2002 to 2016 of Cote d'Ivoire. No data until 2001. Number of actual observations by date: 15.
Source name:
World Development Indicators
Source organization:
World Bank, International Debt Statistics.
Categories, topics:
External Debt
Last updated:
apr 23, 2017
Indicators value changes by year
At the date of observation
Value
Absolute change
Change from previous value
jan 1, 2002
3.918
+3.918
0.0%
jan 1, 2003
4.39
+0.472
12.05%
jan 1, 2004
3.849
-0.54
-12.31%
jan 1, 2005
3.674
-0.175
-4.54%
jan 1, 2006
3.5
-0.174
-4.74%
jan 1, 2007
3.967
+0.467
13.34%
jan 1, 2008
3.987
+0.02
0.49%
jan 1, 2009
4.157
+0.17
4.26%
jan 1, 2010
3.116
-1.041
-25.05%
jan 1, 2011
4.043
+0.928
29.77%
jan 1, 2012
4.067
+0.024
0.59%
jan 1, 2013
4.144
+0.077
1.89%
jan 1, 2014
6.292
+2.149
51.85%
jan 1, 2015
6.91
+0.618
9.82%
jan 1, 2016
6.947
+0.036
0.53%
Ranking of countries by current statistics by years


Comments: