29
/
en
AIzaSyAYiBZKx7MnpbEhh9jyipgxe19OcubqV5w
April 1, 2024
187593
Malaysia
MYS
true
2
1
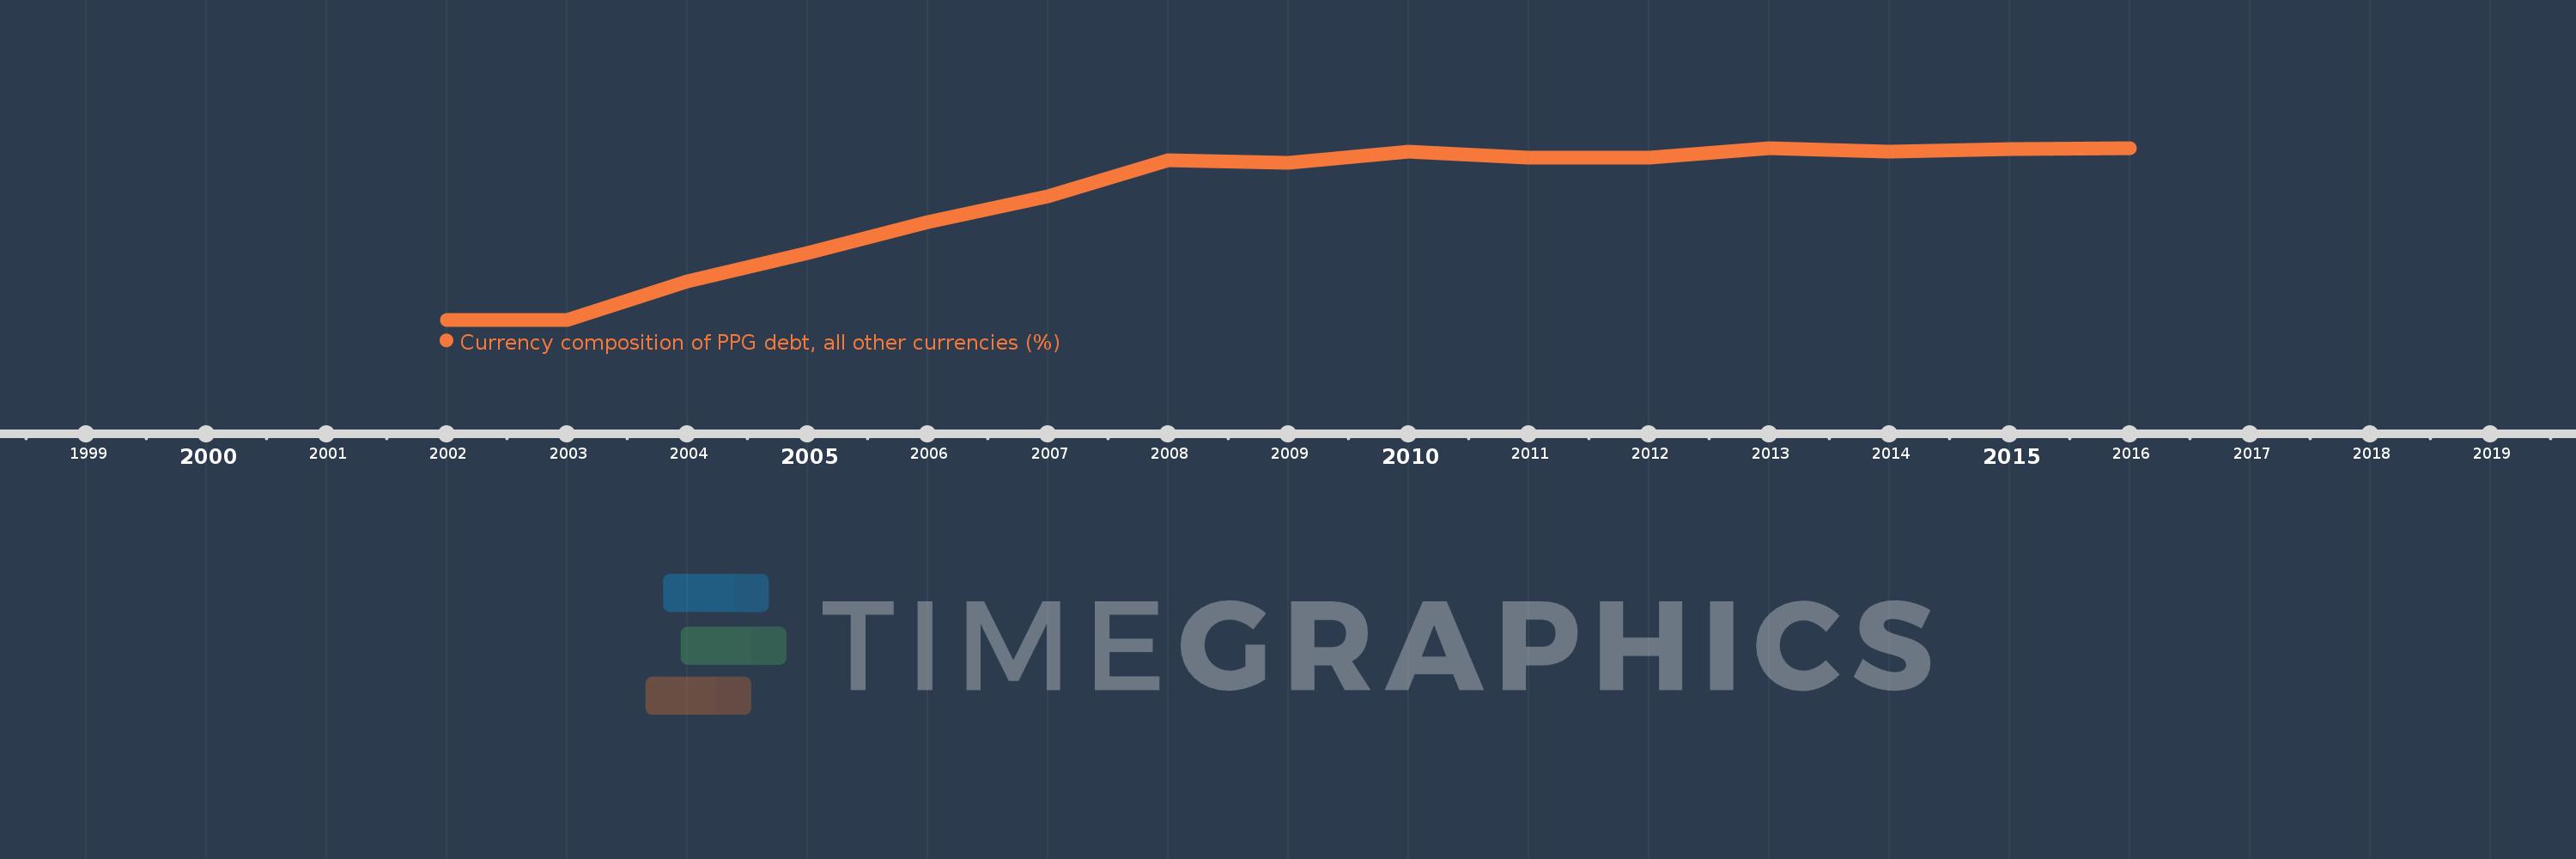
Currency composition of PPG debt, all other currencies (%)
2016,2015,2014,2013,2012,2011,2010,2009,2008,2007,2006,2005,2004,2003,2002
This statistics in other country:
Timeline:
This timeline shows a graph from 2002 to 2016 of Malaysia. No data until 2001. Number of actual observations by date: 15.
Source name:
World Development Indicators
Source organization:
World Bank, International Debt Statistics.
Categories, topics:
External Debt
Last updated:
apr 23, 2017
Indicators value changes by year
Maximum:
61.694
jan 1, 2013
At the date of observation
Value
Absolute change
Change from previous value
jan 1, 2002
0.094
+0.094
0.0%
jan 1, 2003
0.073
-0.021
-22.69%
jan 1, 2004
13.718
+13.645
18.72K%
jan 1, 2005
23.963
+10.245
74.69%
jan 1, 2006
35.104
+11.14
46.49%
jan 1, 2007
44.21
+9.106
25.94%
jan 1, 2008
57.2
+12.991
29.38%
jan 1, 2009
56.485
-0.715
-1.25%
jan 1, 2010
60.453
+3.968
7.03%
jan 1, 2011
58.302
-2.151
-3.56%
jan 1, 2012
58.163
-0.14
-0.24%
jan 1, 2013
61.694
+3.532
6.07%
jan 1, 2014
60.337
-1.357
-2.2%
jan 1, 2015
61.416
+1.078
1.79%
jan 1, 2016
61.553
+0.137
0.22%
Ranking of countries by current statistics by years


Comments: