29
/
en
AIzaSyAYiBZKx7MnpbEhh9jyipgxe19OcubqV5w
April 1, 2024
198933
Mongolia
MNG
true
2
1
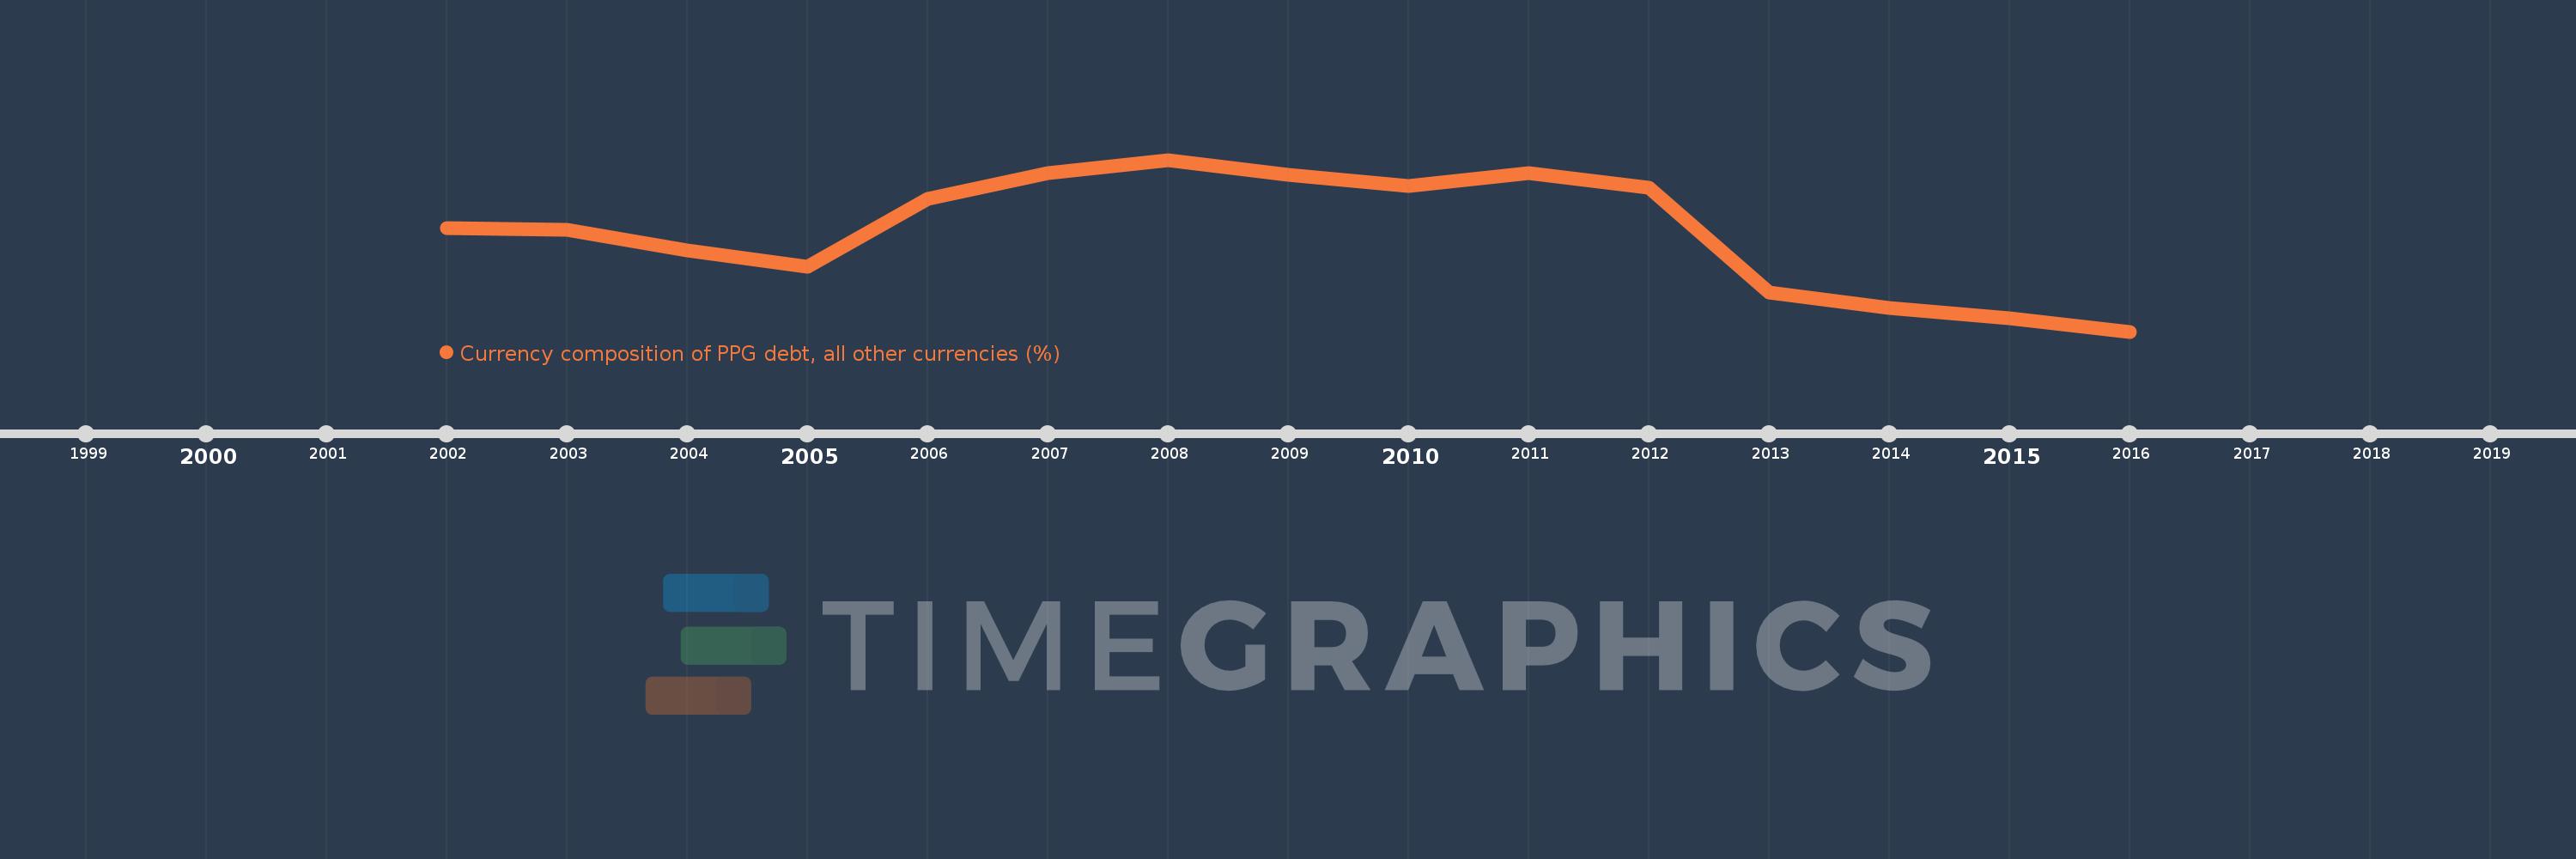
Currency composition of PPG debt, all other currencies (%)
2016,2015,2014,2013,2012,2011,2010,2009,2008,2007,2006,2005,2004,2003,2002
This statistics in other country:
Timeline:
This timeline shows a graph from 2002 to 2016 of Mongolia. No data until 2001. Number of actual observations by date: 15.
Source name:
World Development Indicators
Source organization:
World Bank, International Debt Statistics.
Categories, topics:
External Debt
Last updated:
apr 23, 2017
Indicators value changes by year
At the date of observation
Value
Absolute change
Change from previous value
jan 1, 2002
3.498
+3.498
0.0%
jan 1, 2003
3.458
-0.039
-1.13%
jan 1, 2004
3.051
-0.407
-11.77%
jan 1, 2005
2.731
-0.32
-10.49%
jan 1, 2006
4.058
+1.327
48.57%
jan 1, 2007
4.572
+0.514
12.67%
jan 1, 2008
4.829
+0.257
5.61%
jan 1, 2009
4.537
-0.291
-6.03%
jan 1, 2010
4.314
-0.223
-4.92%
jan 1, 2011
4.573
+0.259
6.0%
jan 1, 2012
4.285
-0.288
-6.31%
jan 1, 2013
2.23
-2.055
-47.95%
jan 1, 2014
1.93
-0.3
-13.47%
jan 1, 2015
1.731
-0.199
-10.3%
jan 1, 2016
1.465
-0.266
-15.37%
Ranking of countries by current statistics by years


Comments: