29
/
en
AIzaSyAYiBZKx7MnpbEhh9jyipgxe19OcubqV5w
April 1, 2024
203989
Myanmar
MMR
true
2
1
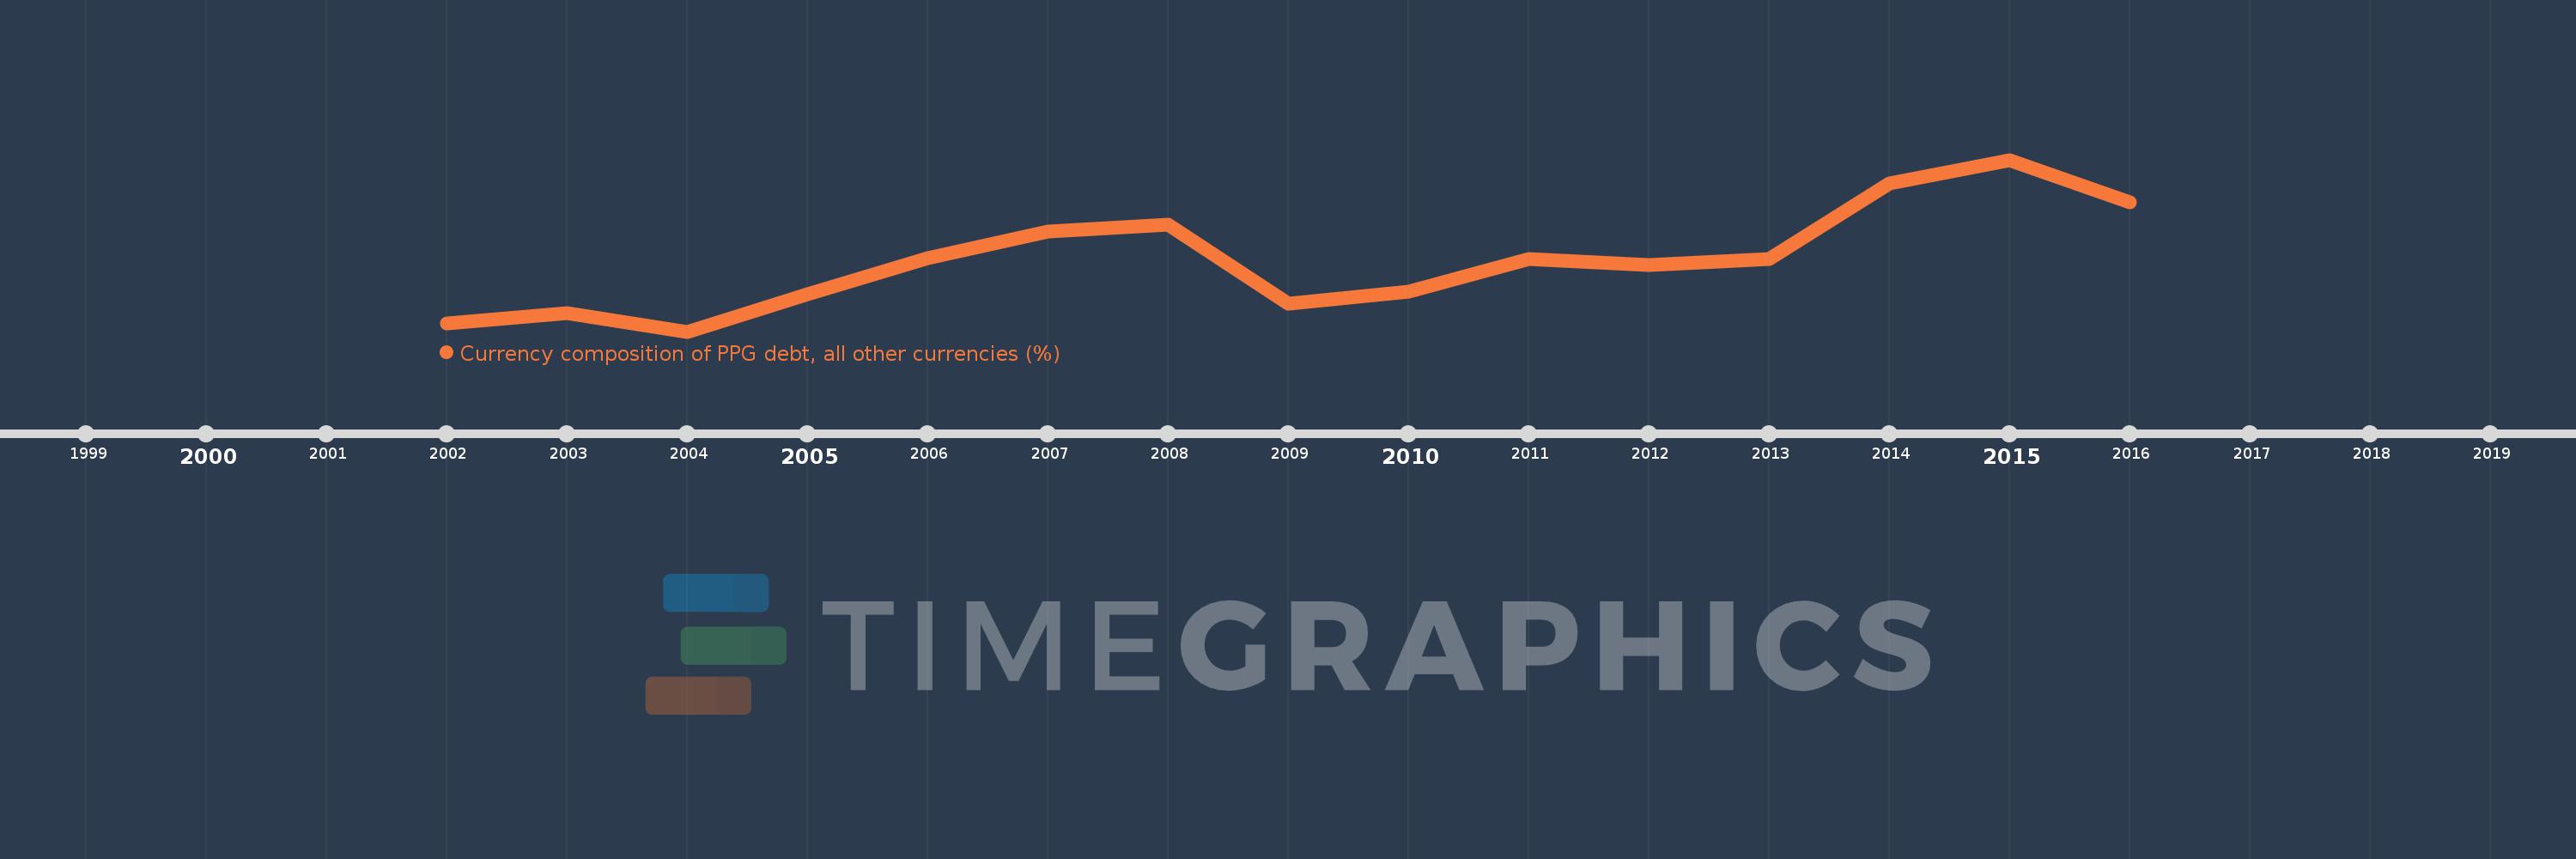
Currency composition of PPG debt, all other currencies (%)
2016,2015,2014,2013,2012,2011,2010,2009,2008,2007,2006,2005,2004,2003,2002
This statistics in other country:
Timeline:
This timeline shows a graph from 2002 to 2016 of Myanmar. No data until 2001. Number of actual observations by date: 15.
Source name:
World Development Indicators
Source organization:
World Bank, International Debt Statistics.
Categories, topics:
External Debt
Last updated:
apr 23, 2017
Indicators value changes by year
At the date of observation
Value
Absolute change
Change from previous value
jan 1, 2002
2.468
+2.468
0.0%
jan 1, 2003
2.511
+0.043
1.72%
jan 1, 2004
2.437
-0.074
-2.95%
jan 1, 2005
2.585
+0.149
6.11%
jan 1, 2006
2.724
+0.138
5.35%
jan 1, 2007
2.828
+0.104
3.83%
jan 1, 2008
2.856
+0.028
0.98%
jan 1, 2009
2.548
-0.308
-10.77%
jan 1, 2010
2.593
+0.045
1.78%
jan 1, 2011
2.722
+0.129
4.97%
jan 1, 2012
2.697
-0.026
-0.94%
jan 1, 2013
2.723
+0.026
0.98%
jan 1, 2014
3.017
+0.294
10.79%
jan 1, 2015
3.111
+0.094
3.12%
jan 1, 2016
2.944
-0.167
-5.37%
Ranking of countries by current statistics by years


Comments: