29
/
en
AIzaSyAYiBZKx7MnpbEhh9jyipgxe19OcubqV5w
April 1, 2024
259395
Tajikistan
TJK
true
2
1
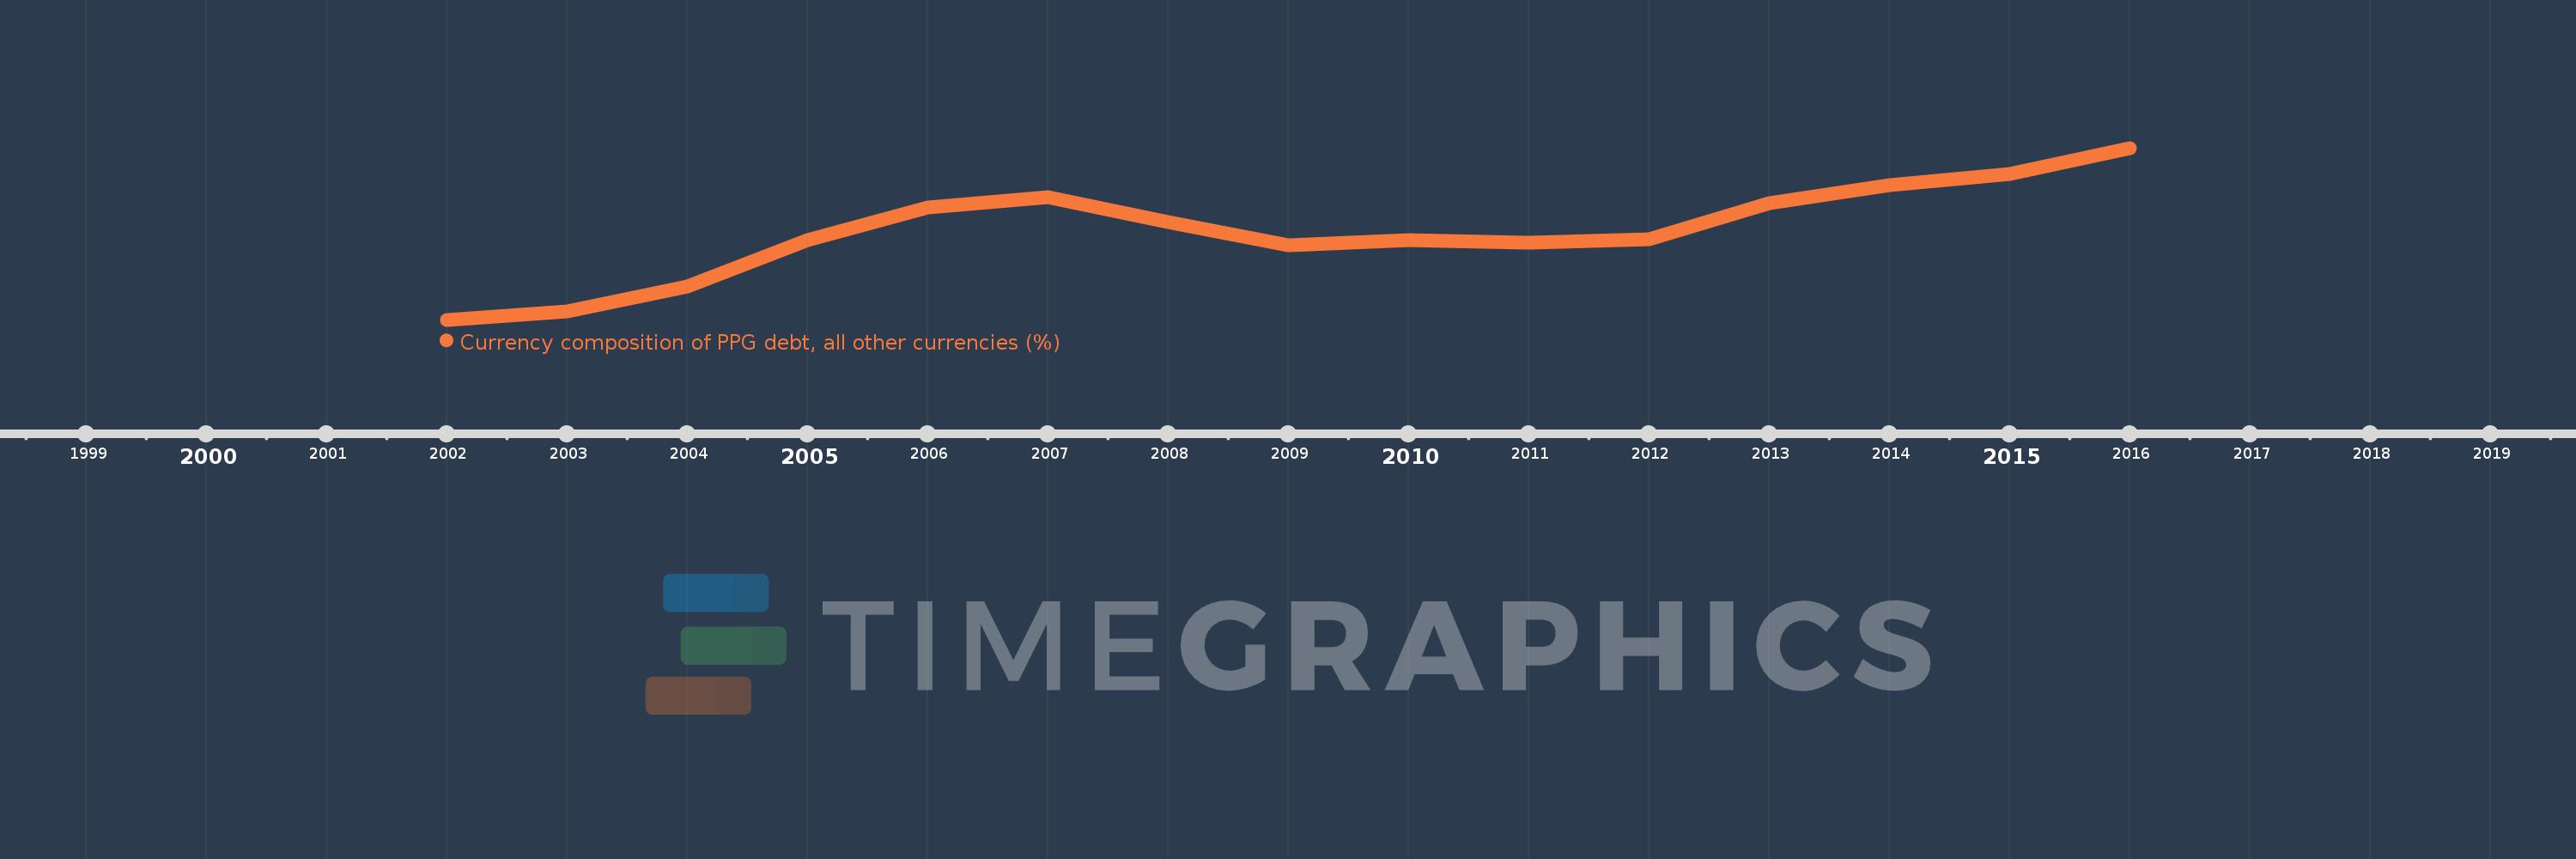
Currency composition of PPG debt, all other currencies (%)
2016,2015,2014,2013,2012,2011,2010,2009,2008,2007,2006,2005,2004,2003,2002
This statistics in other country:
Timeline:
This timeline shows a graph from 2002 to 2016 of Tajikistan. No data until 2001. Number of actual observations by date: 15.
Source name:
World Development Indicators
Source organization:
World Bank, International Debt Statistics.
Categories, topics:
External Debt
Last updated:
apr 23, 2017
Indicators value changes by year
At the date of observation
Value
Absolute change
Change from previous value
jan 1, 2002
2.161
+2.161
0.0%
jan 1, 2003
2.527
+0.366
16.92%
jan 1, 2004
3.583
+1.057
41.83%
jan 1, 2005
5.542
+1.958
54.65%
jan 1, 2006
6.914
+1.372
24.76%
jan 1, 2007
7.343
+0.429
6.21%
jan 1, 2008
6.297
-1.046
-14.25%
jan 1, 2009
5.32
-0.977
-15.52%
jan 1, 2010
5.539
+0.219
4.12%
jan 1, 2011
5.438
-0.1
-1.81%
jan 1, 2012
5.561
+0.123
2.25%
jan 1, 2013
7.098
+1.538
27.65%
jan 1, 2014
7.869
+0.77
10.85%
jan 1, 2015
8.332
+0.463
5.89%
jan 1, 2016
9.44
+1.108
13.3%
Ranking of countries by current statistics by years


Comments: