29
/
en
AIzaSyAYiBZKx7MnpbEhh9jyipgxe19OcubqV5w
April 1, 2024
285707
Zambia
ZMB
true
2
1
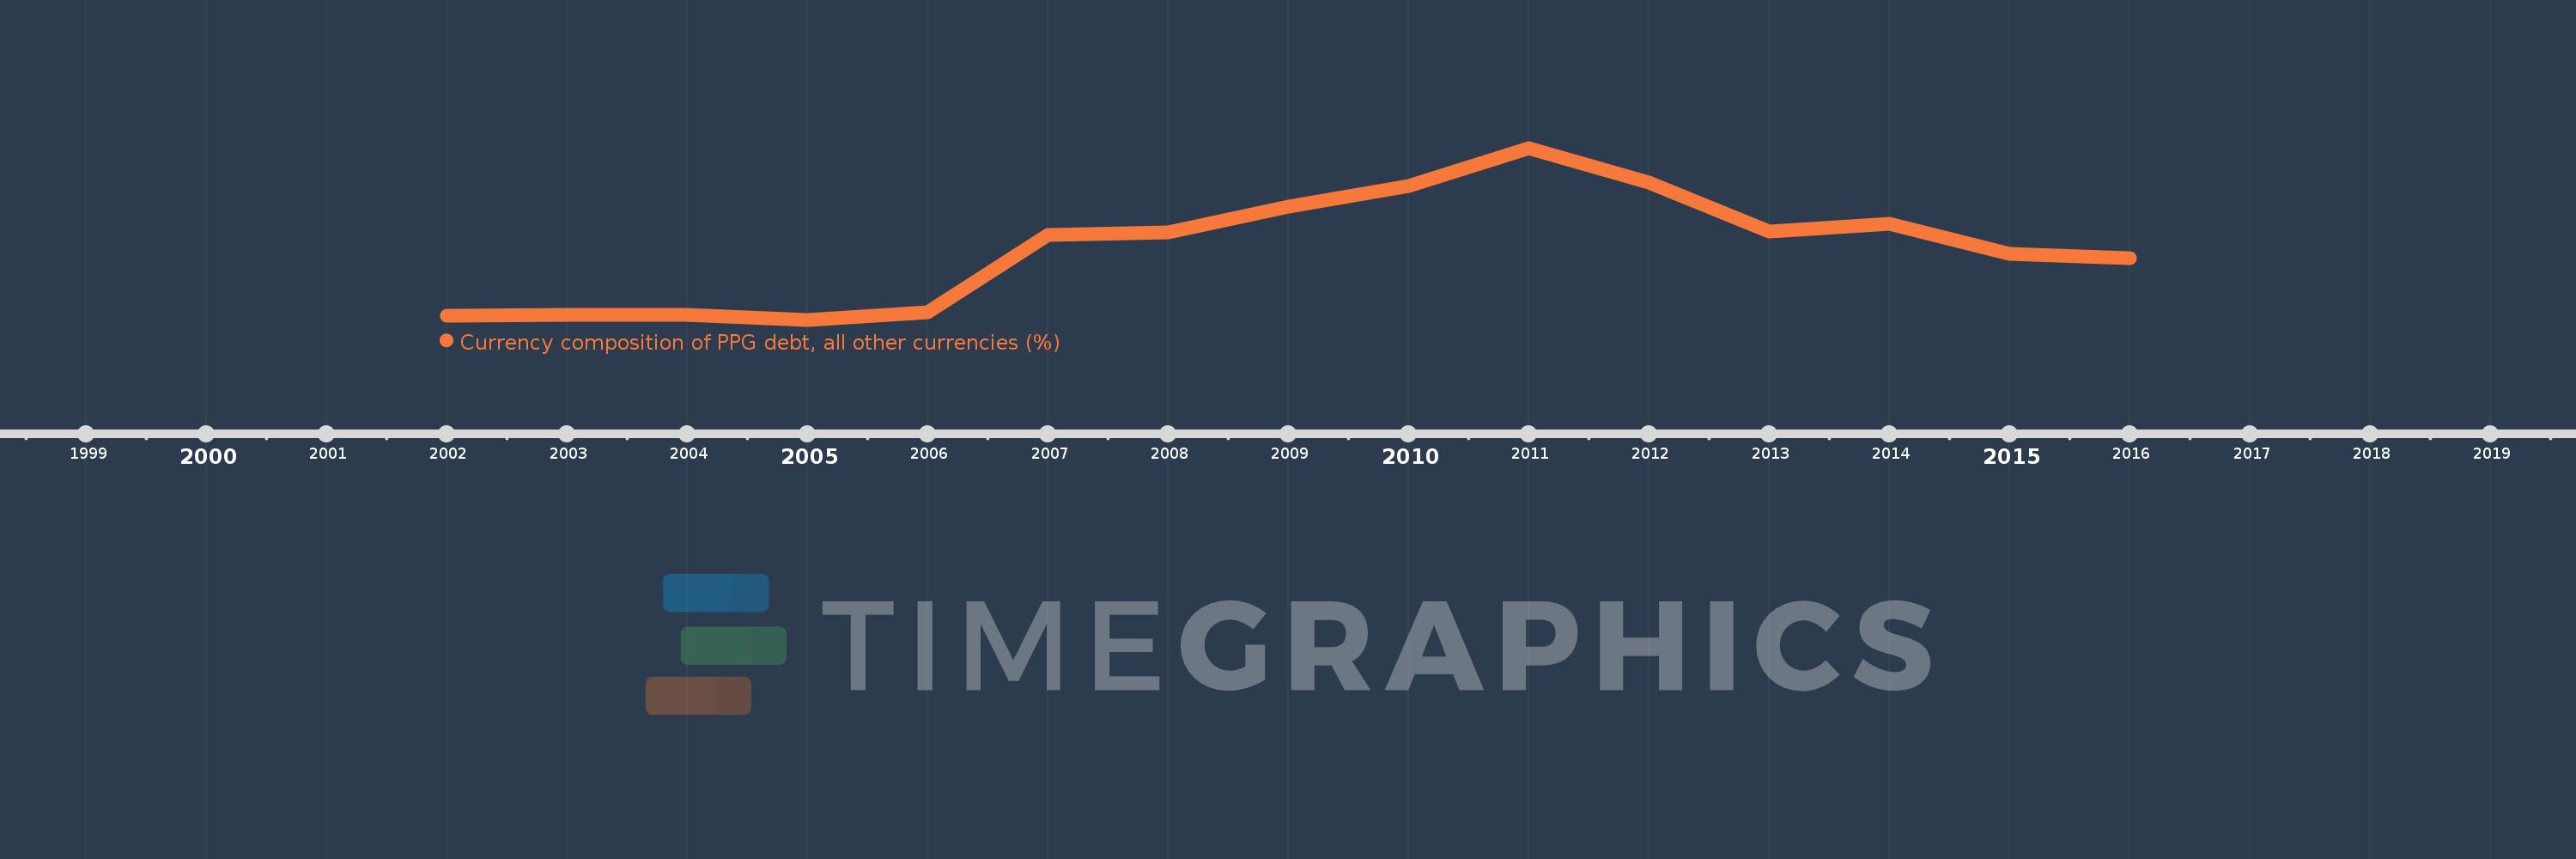
Currency composition of PPG debt, all other currencies (%)
2016,2015,2014,2013,2012,2011,2010,2009,2008,2007,2006,2005,2004,2003,2002
This statistics in other country:
Timeline:
This timeline shows a graph from 2002 to 2016 of Zambia. No data until 2001. Number of actual observations by date: 15.
Source name:
World Development Indicators
Source organization:
World Bank, International Debt Statistics.
Categories, topics:
External Debt
Last updated:
apr 23, 2017
Indicators value changes by year
Maximum:
34.649
jan 1, 2011
At the date of observation
Value
Absolute change
Change from previous value
jan 1, 2002
4.845
+4.845
0.0%
jan 1, 2003
4.966
+0.122
2.51%
jan 1, 2004
4.952
-0.014
-0.29%
jan 1, 2005
4.131
-0.821
-16.57%
jan 1, 2006
5.452
+1.321
31.98%
jan 1, 2007
19.202
+13.749
252.19%
jan 1, 2008
19.663
+0.462
2.4%
jan 1, 2009
24.263
+4.6
23.39%
jan 1, 2010
27.894
+3.631
14.96%
jan 1, 2011
34.649
+6.755
24.22%
jan 1, 2012
28.503
-6.146
-17.74%
jan 1, 2013
19.801
-8.702
-30.53%
jan 1, 2014
21.203
+1.402
7.08%
jan 1, 2015
15.813
-5.389
-25.42%
jan 1, 2016
15.01
-0.804
-5.08%
Ranking of countries by current statistics by years


Comments: