29
/
en
AIzaSyAYiBZKx7MnpbEhh9jyipgxe19OcubqV5w
April 1, 2024
89619
Botswana
BWA
true
2
1
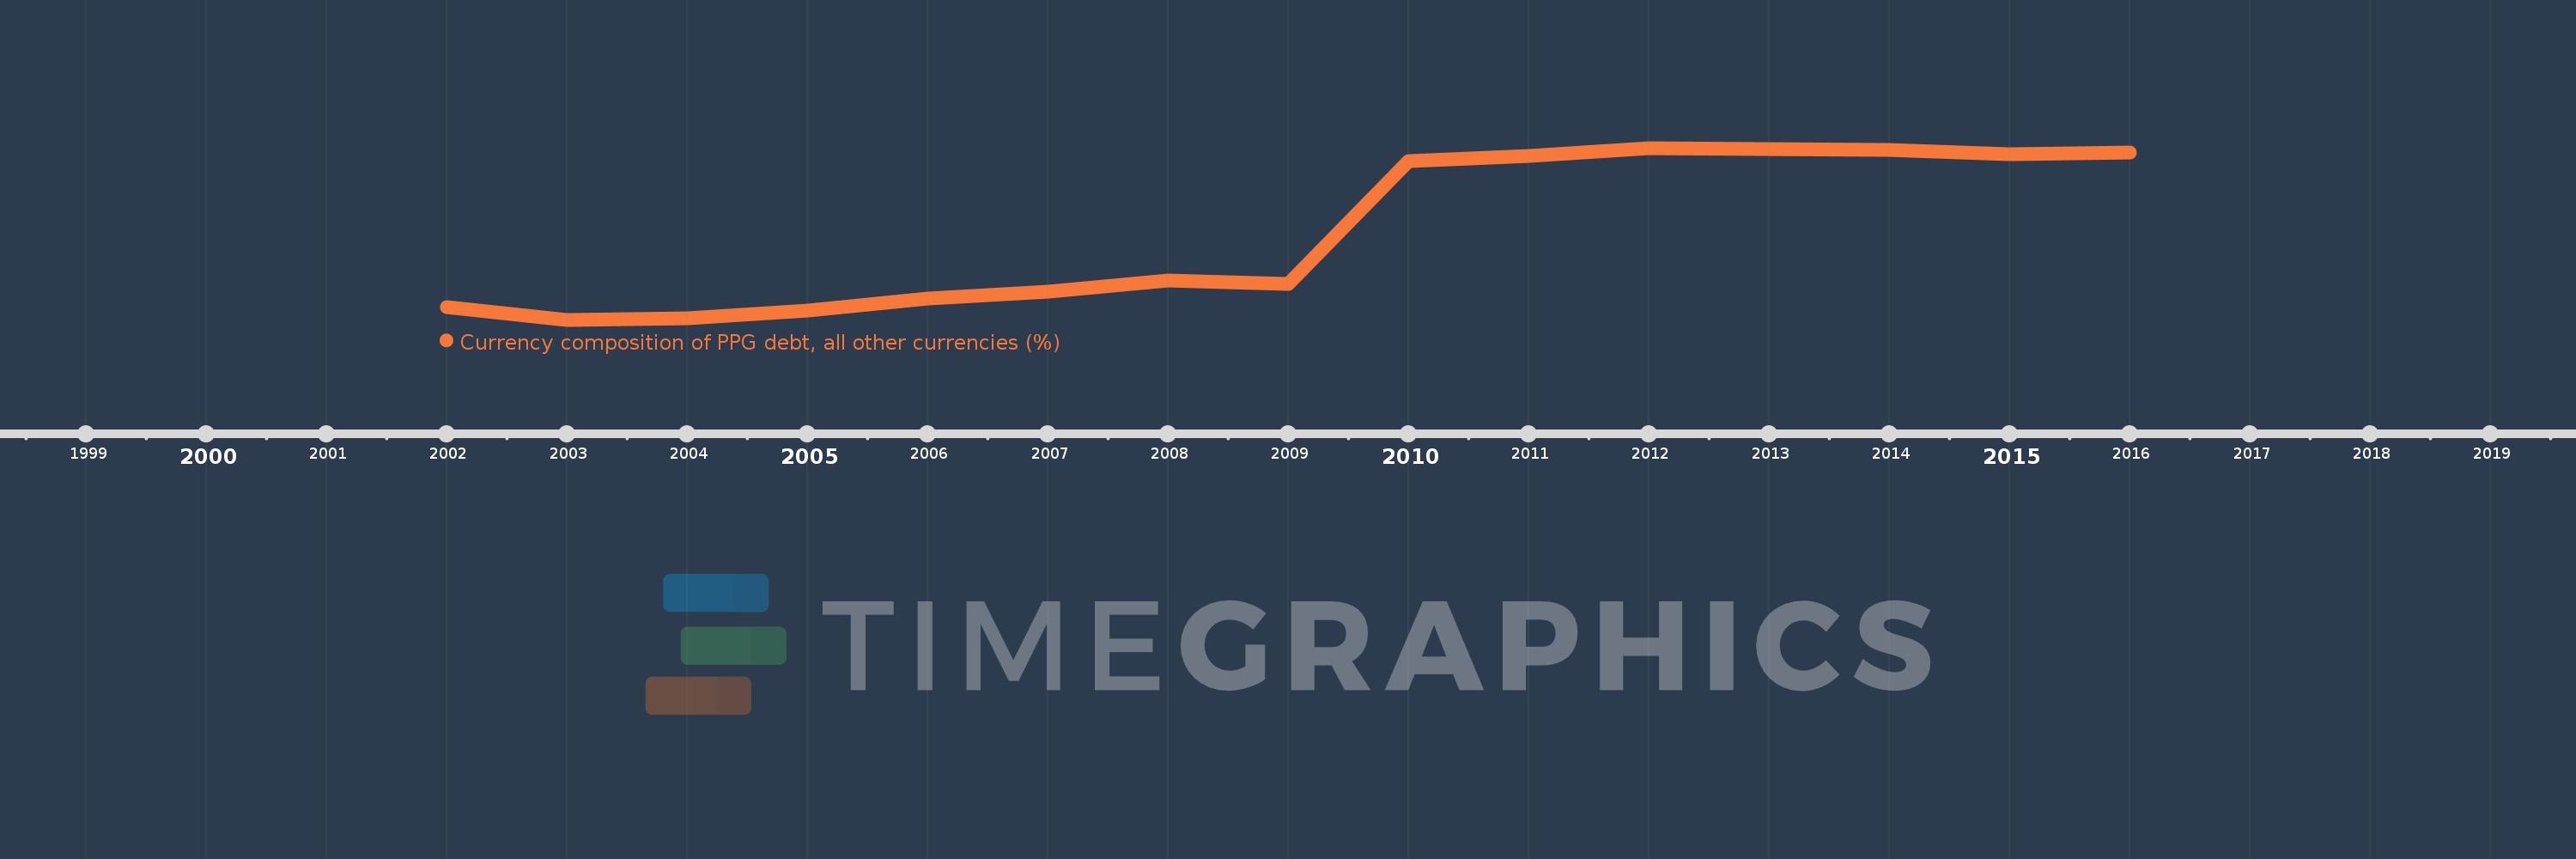
Currency composition of PPG debt, all other currencies (%)
2016,2015,2014,2013,2012,2011,2010,2009,2008,2007,2006,2005,2004,2003,2002
This statistics in other country:
Timeline:
This timeline shows a graph from 2002 to 2016 of Botswana. No data until 2001. Number of actual observations by date: 15.
Source name:
World Development Indicators
Source organization:
World Bank, International Debt Statistics.
Categories, topics:
External Debt
Last updated:
apr 23, 2017
Indicators value changes by year
Minimum:
20.136
jan 1, 2003
Maximum:
86.584
jan 1, 2012
At the date of observation
Value
Absolute change
Change from previous value
jan 1, 2002
24.914
+24.914
0.0%
jan 1, 2003
20.136
-4.778
-19.18%
jan 1, 2004
20.627
+0.49
2.44%
jan 1, 2005
23.825
+3.199
15.51%
jan 1, 2006
28.278
+4.453
18.69%
jan 1, 2007
31.111
+2.833
10.02%
jan 1, 2008
35.233
+4.122
13.25%
jan 1, 2009
33.904
-1.329
-3.77%
jan 1, 2010
81.646
+47.742
140.82%
jan 1, 2011
83.408
+1.761
2.16%
jan 1, 2012
86.584
+3.176
3.81%
jan 1, 2013
86.143
-0.441
-0.51%
jan 1, 2014
85.826
-0.317
-0.37%
jan 1, 2015
84.188
-1.638
-1.91%
jan 1, 2016
84.725
+0.538
0.64%
Ranking of countries by current statistics by years


Comments: