29
/
en
AIzaSyAYiBZKx7MnpbEhh9jyipgxe19OcubqV5w
April 1, 2024
140187
Ghana
GHA
true
2
1
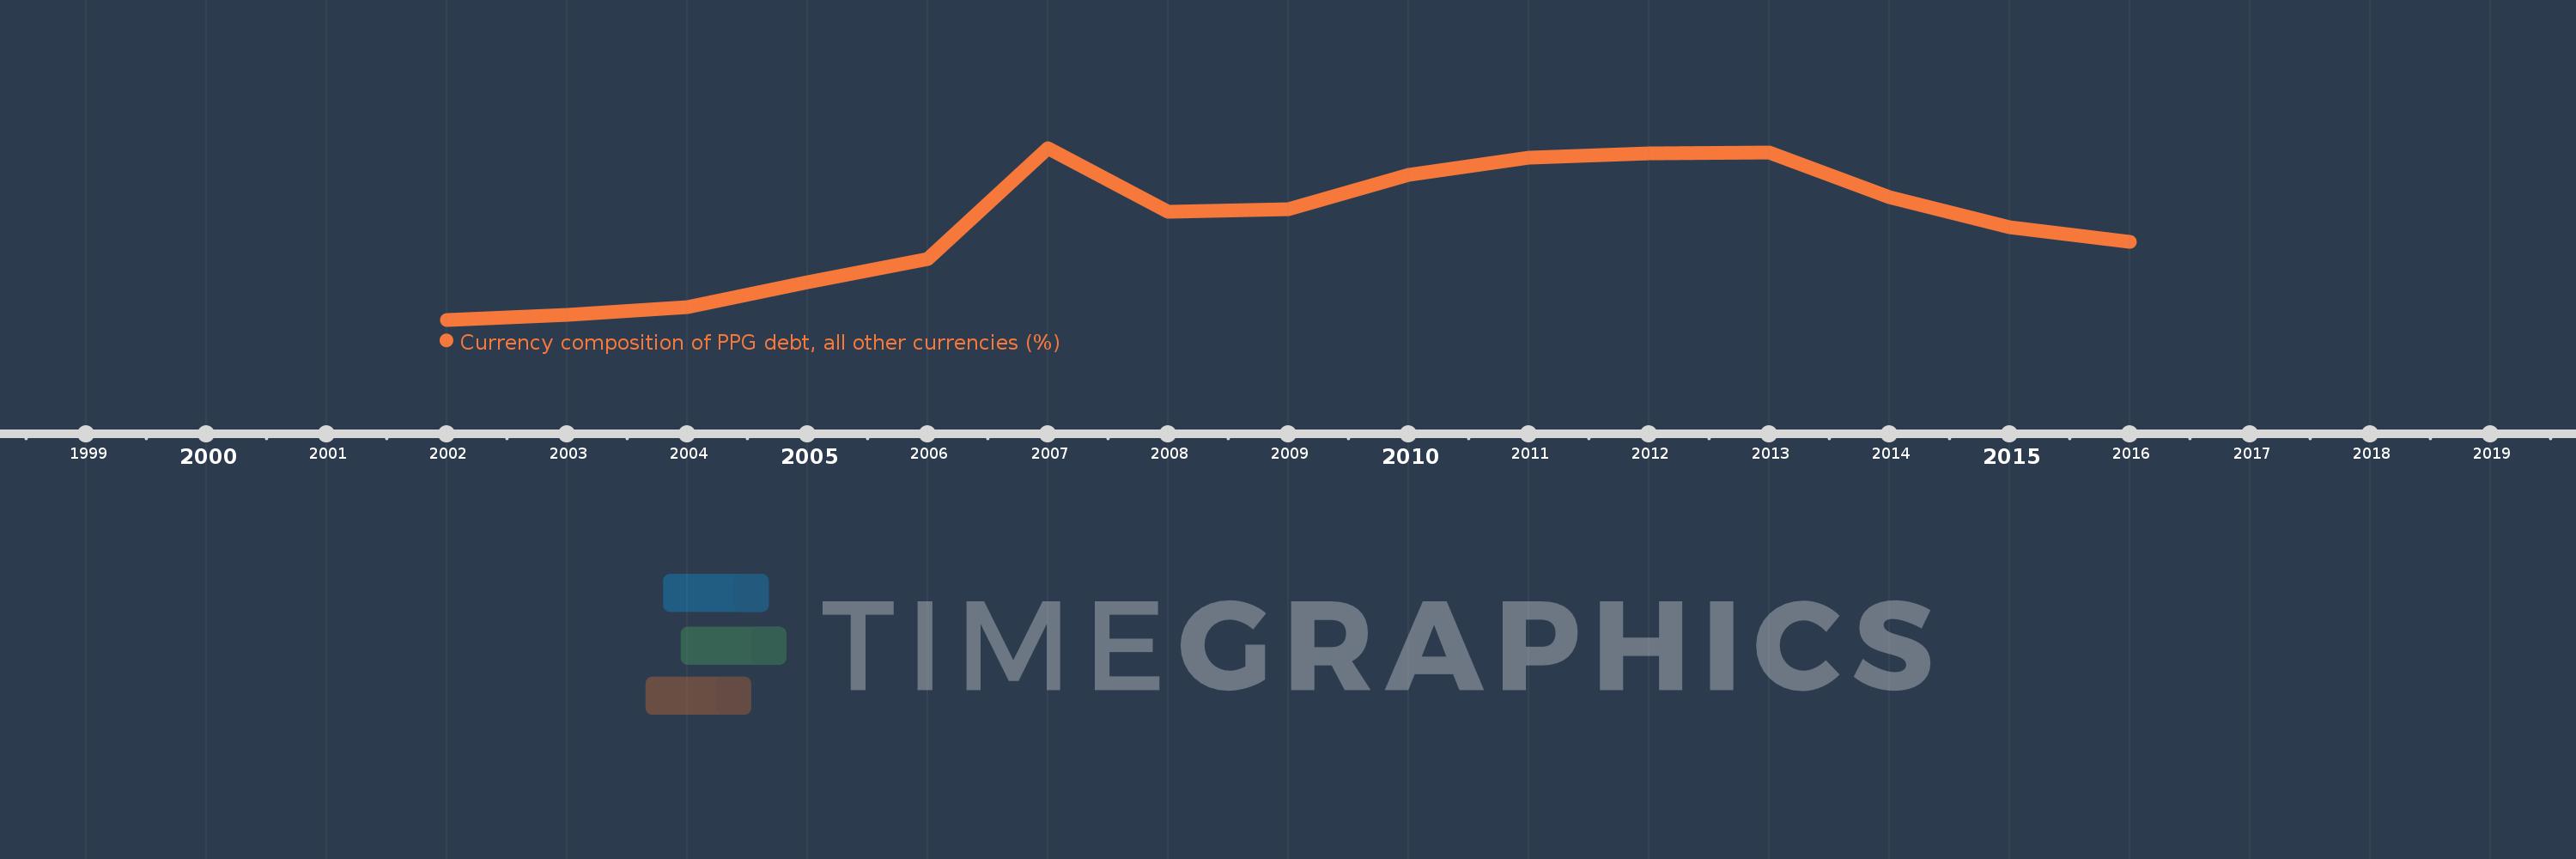
Currency composition of PPG debt, all other currencies (%)
2016,2015,2014,2013,2012,2011,2010,2009,2008,2007,2006,2005,2004,2003,2002
This statistics in other country:
Timeline:
This timeline shows a graph from 2002 to 2016 of Ghana. No data until 2001. Number of actual observations by date: 15.
Source name:
World Development Indicators
Source organization:
World Bank, International Debt Statistics.
Categories, topics:
External Debt
Last updated:
apr 23, 2017
Indicators value changes by year
Maximum:
13.927
jan 1, 2007
At the date of observation
Value
Absolute change
Change from previous value
jan 1, 2002
4.528
+4.528
0.0%
jan 1, 2003
4.783
+0.255
5.63%
jan 1, 2004
5.212
+0.429
8.97%
jan 1, 2005
6.602
+1.39
26.67%
jan 1, 2006
7.835
+1.234
18.69%
jan 1, 2007
13.927
+6.091
77.74%
jan 1, 2008
10.433
-3.493
-25.08%
jan 1, 2009
10.599
+0.165
1.58%
jan 1, 2010
12.461
+1.862
17.57%
jan 1, 2011
13.405
+0.944
7.57%
jan 1, 2012
13.621
+0.216
1.61%
jan 1, 2013
13.689
+0.069
0.5%
jan 1, 2014
11.242
-2.448
-17.88%
jan 1, 2015
9.605
-1.637
-14.56%
jan 1, 2016
8.788
-0.817
-8.51%
Ranking of countries by current statistics by years


Comments: