29
/
en
AIzaSyAYiBZKx7MnpbEhh9jyipgxe19OcubqV5w
April 1, 2024
38857
IDA only
IDX
false
2
1
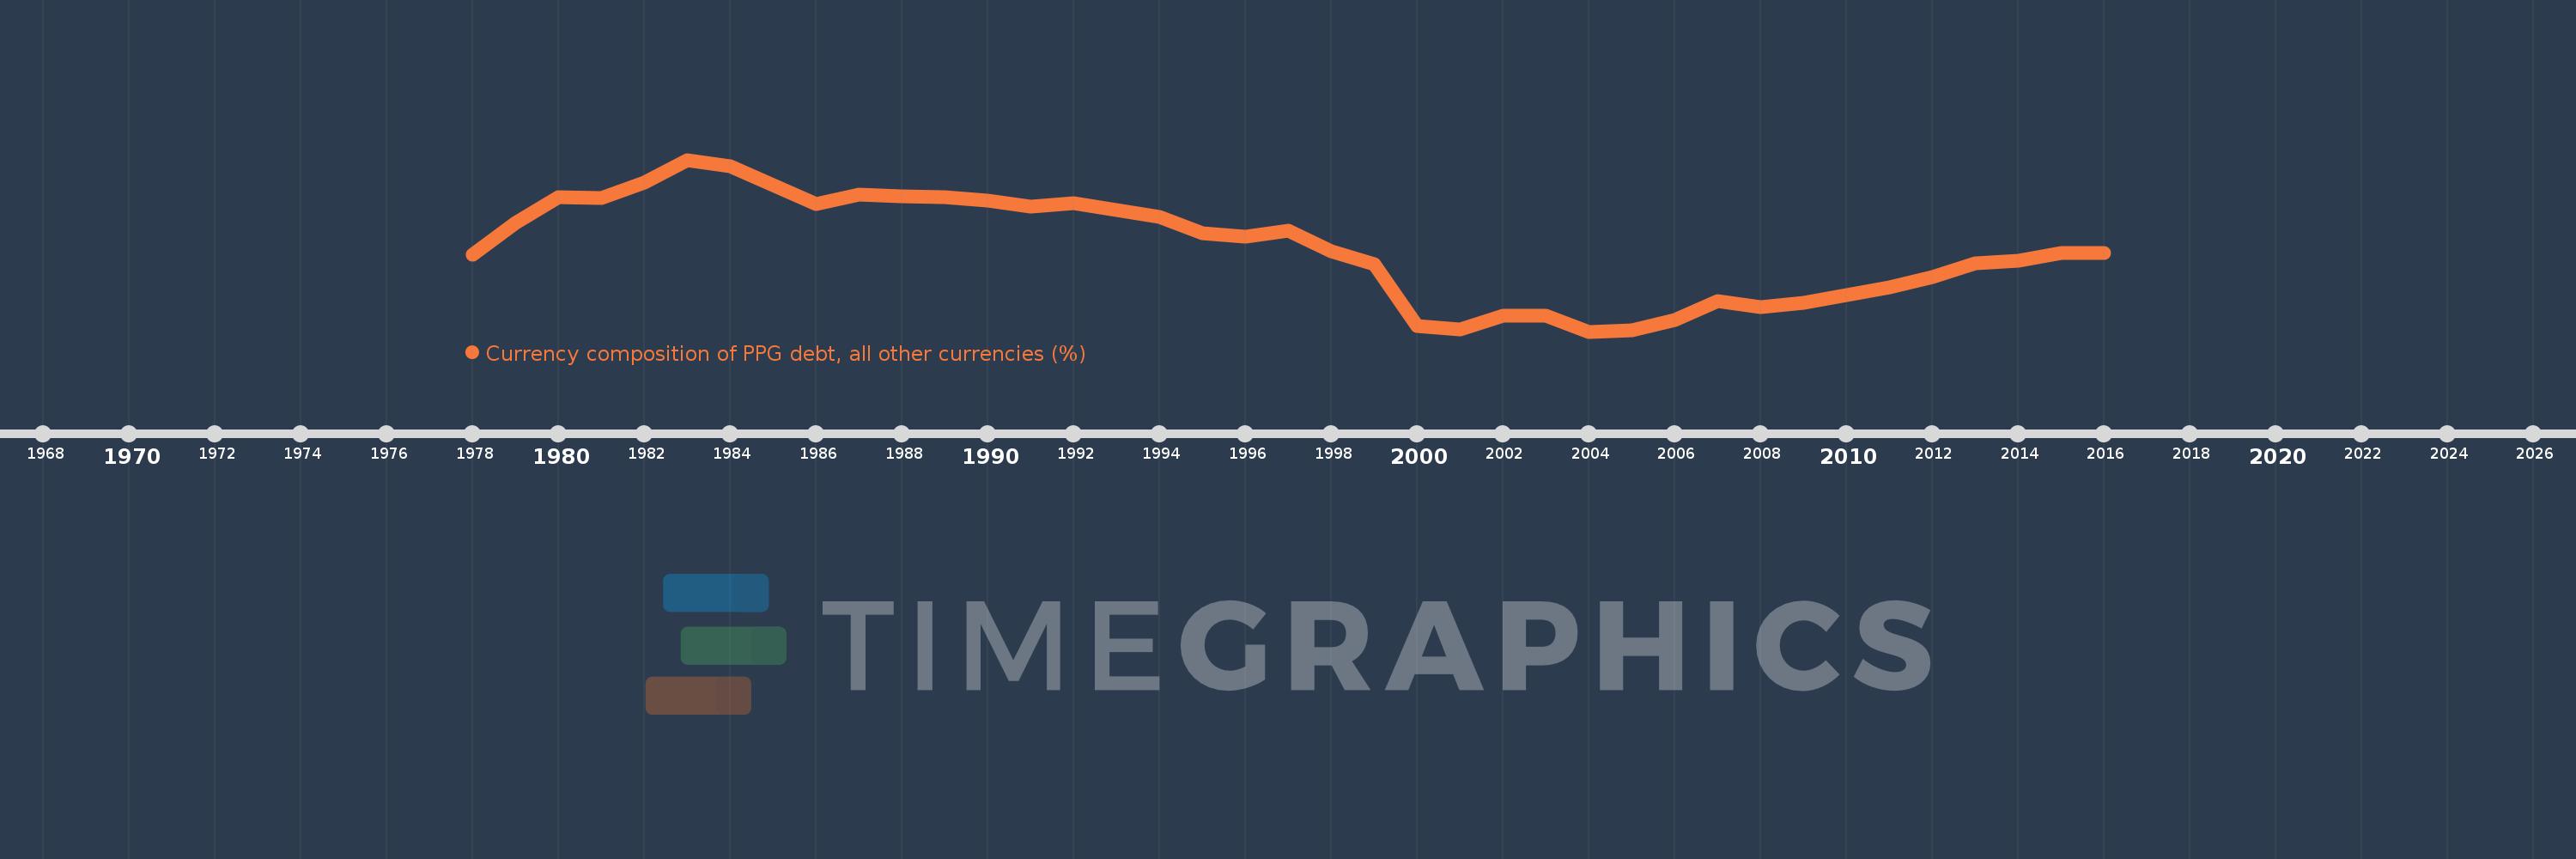
Currency composition of PPG debt, all other currencies (%)
2016,2015,2014,2013,2012,2011,2010,2009,2008,2007,2006,2005,2004,2003,2002,2001,2000,1999,1998,1997,1996,1995,1994,1993,1992,1991,1990,1989,1988,1987,1986,1985,1984,1983,1982,1981,1980,1979,1978
This statistics in other country:
Timeline:
This timeline shows a graph from 1978 to 2016 of IDA only. No data until 1977. Number of actual observations by date: 39.
Source name:
World Development Indicators
Source organization:
World Bank, International Debt Statistics.
Categories, topics:
External Debt
Last updated:
apr 23, 2017
Indicators value changes by year
Maximum:
18.269
jan 1, 1983
At the date of observation
Value
Absolute change
Change from previous value
jan 1, 1978
12.546
+12.546
0.0%
jan 1, 1979
14.433
+1.887
15.04%
jan 1, 1980
15.994
+1.561
10.82%
jan 1, 1981
15.954
-0.04
-0.25%
jan 1, 1982
16.901
+0.947
5.94%
jan 1, 1983
18.269
+1.368
8.09%
jan 1, 1984
17.857
-0.412
-2.25%
jan 1, 1985
16.738
-1.119
-6.27%
jan 1, 1986
15.575
-1.163
-6.95%
jan 1, 1987
16.155
+0.58
3.72%
jan 1, 1988
16.057
-0.098
-0.6%
jan 1, 1989
15.983
-0.074
-0.46%
jan 1, 1990
15.776
-0.206
-1.29%
jan 1, 1991
15.416
-0.36
-2.28%
jan 1, 1992
15.619
+0.203
1.32%
jan 1, 1993
15.246
-0.373
-2.39%
jan 1, 1994
14.805
-0.441
-2.89%
jan 1, 1995
13.82
-0.985
-6.65%
jan 1, 1996
13.613
-0.207
-1.5%
jan 1, 1997
13.963
+0.35
2.57%
jan 1, 1998
12.72
-1.243
-8.9%
jan 1, 1999
11.959
-0.762
-5.99%
jan 1, 2000
8.215
-3.744
-31.31%
jan 1, 2001
7.986
-0.229
-2.79%
jan 1, 2002
8.82
+0.834
10.44%
jan 1, 2003
8.807
-0.013
-0.14%
jan 1, 2004
7.865
-0.943
-10.7%
jan 1, 2005
7.937
+0.073
0.93%
jan 1, 2006
8.591
+0.653
8.23%
jan 1, 2007
9.719
+1.129
13.14%
jan 1, 2008
9.337
-0.382
-3.93%
jan 1, 2009
9.589
+0.252
2.7%
jan 1, 2010
10.05
+0.461
4.8%
jan 1, 2011
10.528
+0.478
4.76%
jan 1, 2012
11.168
+0.641
6.08%
jan 1, 2013
12.016
+0.847
7.59%
jan 1, 2014
12.15
+0.134
1.12%
jan 1, 2015
12.627
+0.477
3.93%
jan 1, 2016
12.608
-0.019
-0.15%
Ranking of countries by current statistics by years


Comments: