29
/
en
AIzaSyAYiBZKx7MnpbEhh9jyipgxe19OcubqV5w
April 1, 2024
177508
Lesotho
LSO
true
2
1
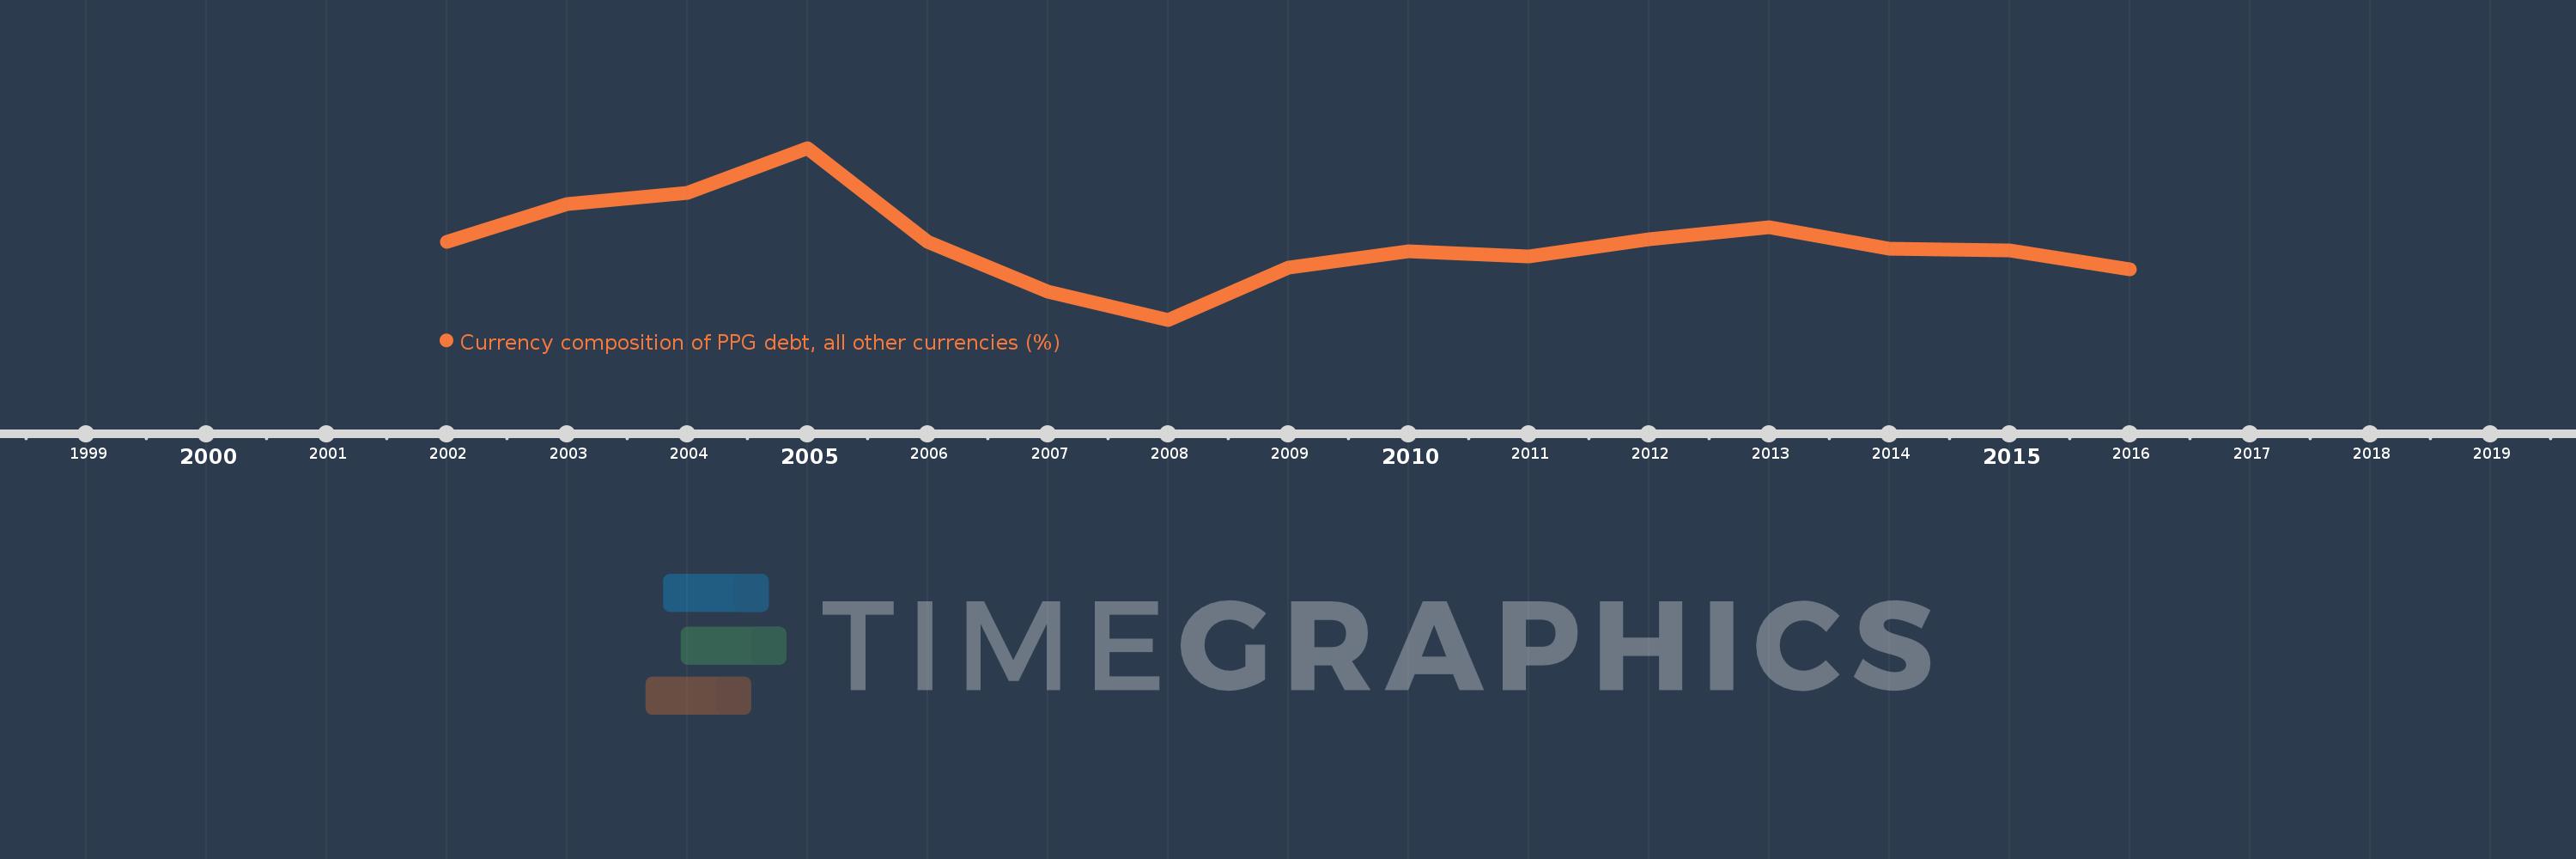
Currency composition of PPG debt, all other currencies (%)
2016,2015,2014,2013,2012,2011,2010,2009,2008,2007,2006,2005,2004,2003,2002
This statistics in other country:
Timeline:
This timeline shows a graph from 2002 to 2016 of Lesotho. No data until 2001. Number of actual observations by date: 15.
Source name:
World Development Indicators
Source organization:
World Bank, International Debt Statistics.
Categories, topics:
External Debt
Last updated:
apr 23, 2017
Indicators value changes by year
Minimum:
33.576
jan 1, 2008
Maximum:
40.615
jan 1, 2005
At the date of observation
Value
Absolute change
Change from previous value
jan 1, 2002
36.76
+36.76
0.0%
jan 1, 2003
38.322
+1.562
4.25%
jan 1, 2004
38.773
+0.451
1.18%
jan 1, 2005
40.615
+1.843
4.75%
jan 1, 2006
36.754
-3.862
-9.51%
jan 1, 2007
34.712
-2.042
-5.56%
jan 1, 2008
33.576
-1.136
-3.27%
jan 1, 2009
35.712
+2.136
6.36%
jan 1, 2010
36.366
+0.654
1.83%
jan 1, 2011
36.172
-0.194
-0.53%
jan 1, 2012
36.872
+0.7
1.94%
jan 1, 2013
37.36
+0.488
1.32%
jan 1, 2014
36.495
-0.865
-2.32%
jan 1, 2015
36.425
-0.07
-0.19%
jan 1, 2016
35.63
-0.795
-2.18%
Ranking of countries by current statistics by years


Comments: