29
/
en
AIzaSyAYiBZKx7MnpbEhh9jyipgxe19OcubqV5w
April 1, 2024
162364
Jamaica
JAM
true
2
1
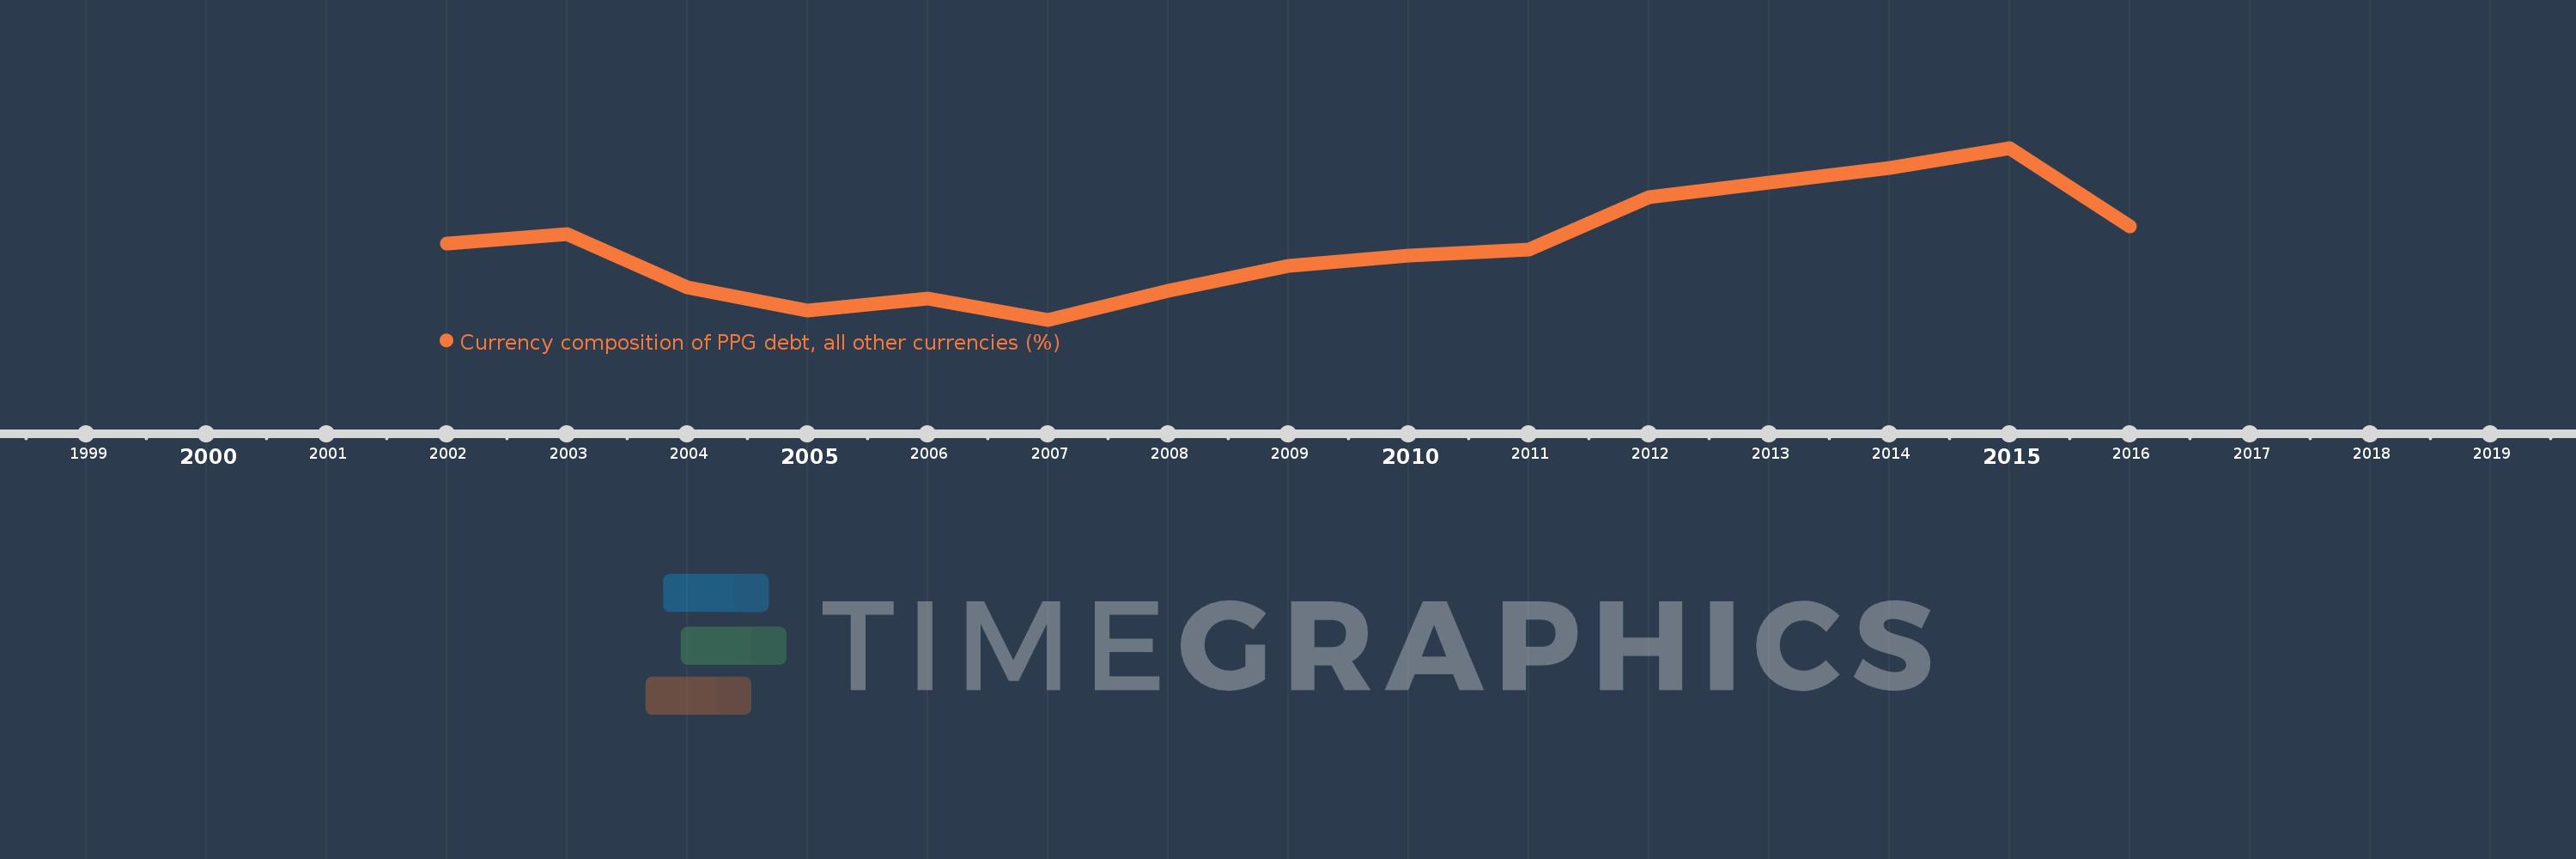
Currency composition of PPG debt, all other currencies (%)
2016,2015,2014,2013,2012,2011,2010,2009,2008,2007,2006,2005,2004,2003,2002
This statistics in other country:
Timeline:
This timeline shows a graph from 2002 to 2016 of Jamaica. No data until 2001. Number of actual observations by date: 15.
Source name:
World Development Indicators
Source organization:
World Bank, International Debt Statistics.
Categories, topics:
External Debt
Last updated:
apr 23, 2017
Indicators value changes by year
At the date of observation
Value
Absolute change
Change from previous value
jan 1, 2002
1.516
+1.516
0.0%
jan 1, 2003
1.571
+0.056
3.7%
jan 1, 2004
1.26
-0.312
-19.85%
jan 1, 2005
1.126
-0.133
-10.59%
jan 1, 2006
1.197
+0.071
6.32%
jan 1, 2007
1.073
-0.124
-10.35%
jan 1, 2008
1.244
+0.171
15.89%
jan 1, 2009
1.389
+0.145
11.67%
jan 1, 2010
1.45
+0.061
4.39%
jan 1, 2011
1.481
+0.03
2.08%
jan 1, 2012
1.788
+0.307
20.75%
jan 1, 2013
1.876
+0.088
4.94%
jan 1, 2014
1.96
+0.084
4.48%
jan 1, 2015
2.077
+0.117
5.96%
jan 1, 2016
1.618
-0.459
-22.11%
Ranking of countries by current statistics by years


Comments: